Jun-2026
Sales
Trend
6-Month
Product Count
SKUs
Avg Price
YoY Sales Change
YoY Price Change
Market Insights Snapshot
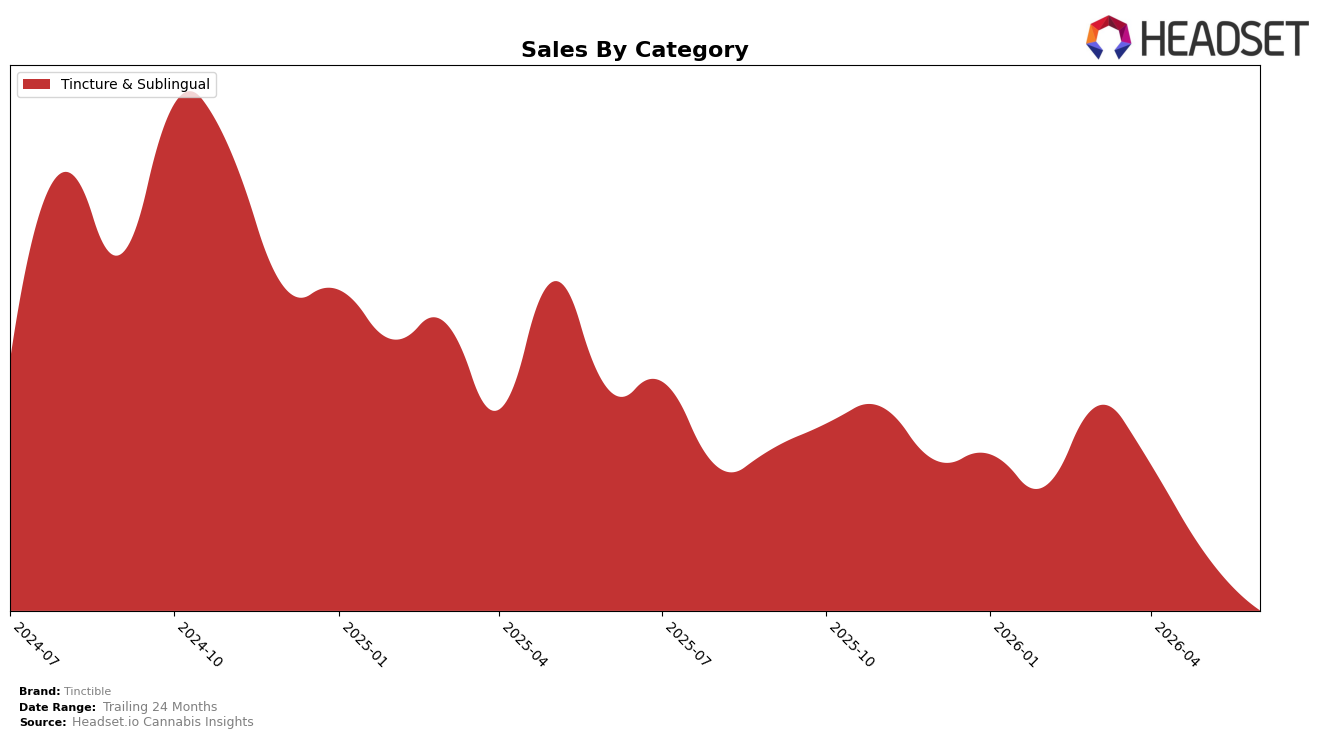
In June 2026, Tinctible operated as a single-category brand with Tincture & Sublingual accounting for 100.0% category share and a month-over-month change of -40.53% alongside a year-over-year decline of -72.36%. Average price moved to $17.35 with a year-over-year decrease of -12.44%, while the category’s share concentration at 100.0% meant no offset from other formats despite a 24-month brand sales contraction of -74.68%. The pattern implies a reliance on one format that amplifies volatility: when Tincture & Sublingual demand retrenches by -40.53% MoM and -72.36% YoY, Tinctible’s total performance compresses in lockstep, concentrating risk rather than distributing it across categories.
With all revenue tied to Tincture & Sublingual in Ohio, the -12.44% YoY price reduction did not mitigate the -40.53% MoM and -72.36% YoY volume-driven headwinds, indicating price concessions are not the primary lever of change. Given the absence of a reported rank in Tincture & Sublingual for June 2026 and a 24-month decline of -74.68%, the brand’s positioning is skewed toward a shrinking demand pocket rather than a mixed-portfolio buffer; the implication is that maintaining a 100.0% category share concentration keeps Tinctible exposed to further rank instability whenever Tincture & Sublingual softens.
Competitive Landscape
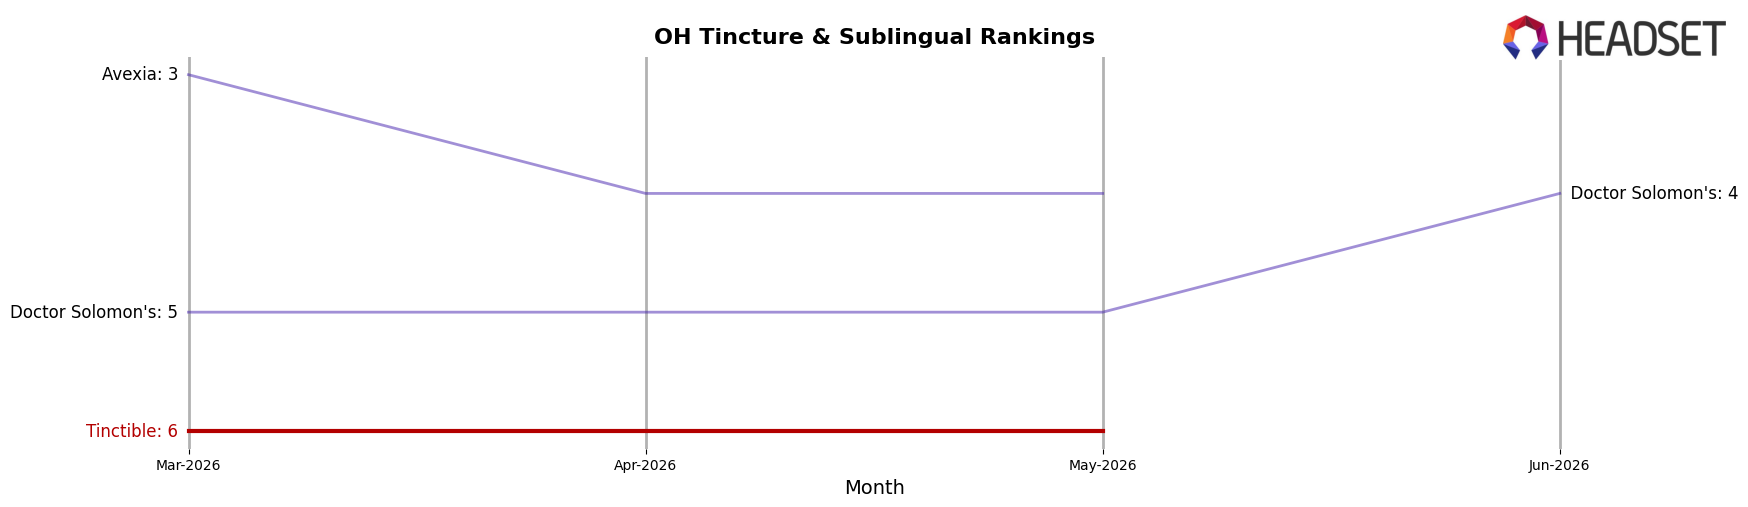
Tinctible sits at rank #7 in Ohio Tincture & Sublingual for June 2026, sliding 1 position year over year from #6 while also easing 1 position versus March 2026 when it held #6; against the field, Standard Farms advanced from #4 to #3 with 17.4% YoY sales growth while Doctor Solomon's moved down from #3 to #4 on a 46.3% YoY decline, positioning Tinctible behind both upward and downward movers. Compared with its peak at #4 in February 2025, Tinctible is now 3 ranks lower and 1 rank softer than three months ago, whereas UB GOOD held #1 year over year and in June 2026 with 13.5% YoY growth, indicating that Tinctible’s recent drift from #6 to #7 amid mixed competitor momentum implies a gradual loss of share-of-preference rather than a category-wide contraction.
Notable Products
Squeeze In - THC/CBN 3:1 Blueberry Lavender Sleep Gel 11-Pack (110mg THC, 33mg CBN) posted the steepest movement in June 2026 with a -64.38% month-over-month drop while still holding rank 2, implying demand compression outpaced peers despite a top-tier position. The top-ranked Squeeze In- THC/CBG/CBD 2:1:1 Relief Blue Raspberry Gel 11-Pack (110mg THC, 55mg CBG, 55mg CBD) slipped -8.86% MoM at rank 1 and the Squeeze In- CBD/THC 1:1 Spark Watermelon Gel 11-Pack (110mg CBD, 110mg THC) fell -15.28% MoM at rank 3, signaling a tiered pullback across the podium. All three top-3 SKUs are Tincture & Sublingual formats, indicating category concentration that concentrates risk if June 2026 volatility persists.
Top Selling Cannabis Brands
Data for this report comes from real-time sales reporting by participating cannabis retailers via their point-of-sale systems, which are linked up with Headset’s business intelligence software. Headset’s data is very reliable, as it comes digitally direct from our partner retailers. However, the potential does exist for misreporting in the instance of duplicates, incorrectly classified products, inaccurate entry of products into point-of-sale systems, or even simple human error at the point of purchase. Thus, there is a slight margin of error to consider. Brands listed on this page are ranked in the top twenty within the market and product category by total retail sales volume.

