Jun-2026
Sales
Trend
6-Month
Product Count
SKUs
Avg Price
YoY Sales Change
YoY Price Change
Market Insights Snapshot
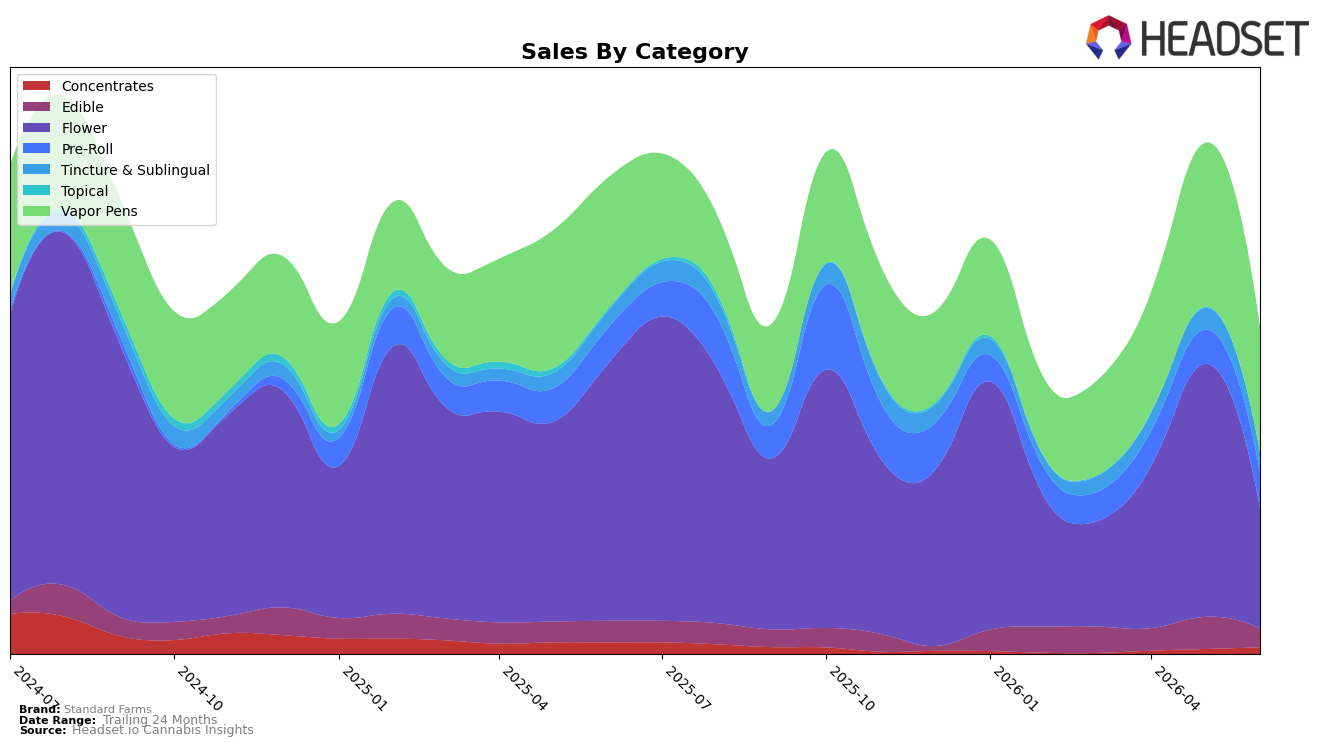
Standard Farms concentrated nearly three-quarters of June 2026 sales in two categories as Vapor Pens held 37.79% share and Flower 36.44%, yet both contracted sharply month over month with Vapor Pens down 23.84% and Flower down 52.35%, while year over year Vapor Pens dipped 4.80% and Flower fell 53.16%. Smaller lines moved in opposite directions: Pre-Roll gained 5.50% MoM and 1.13% YoY to 11.14% share, and Concentrates jumped 29.30% MoM despite a 40.13% YoY decline, whereas Edible dropped 40.44% MoM and 12.30% YoY and Topical slid 36.36% MoM and 63.19% YoY; this pattern implies a rapid rebalance away from Flower toward inhalables with steadier velocity, even as the brand’s overall sales fell 31.09% YoY and its average price declined 18.93% YoY to $24.13.
With Vapor Pens at rank 23 in Ohio and accounting for 37.79% of mix while posting a 23.84% MoM contraction, the brand’s positioning leans on a mid-pack inhalables foothold that is not yet offsetting the 52.35% MoM pullback in Flower’s 36.44% share. The incremental growth vectors—Pre-Roll rising 5.50% MoM to 11.14% share and Concentrates up 29.30% MoM at 2.23% share—are too small to counter simultaneous YoY drag in Edible at 12.30% and Topical at 63.19%, implying the path forward is to consolidate around Vapor Pens and Pre-Roll where unit elasticity supports the 18.93% YoY price compression while narrowing exposure to categories showing double-digit MoM declines.
Competitive Landscape
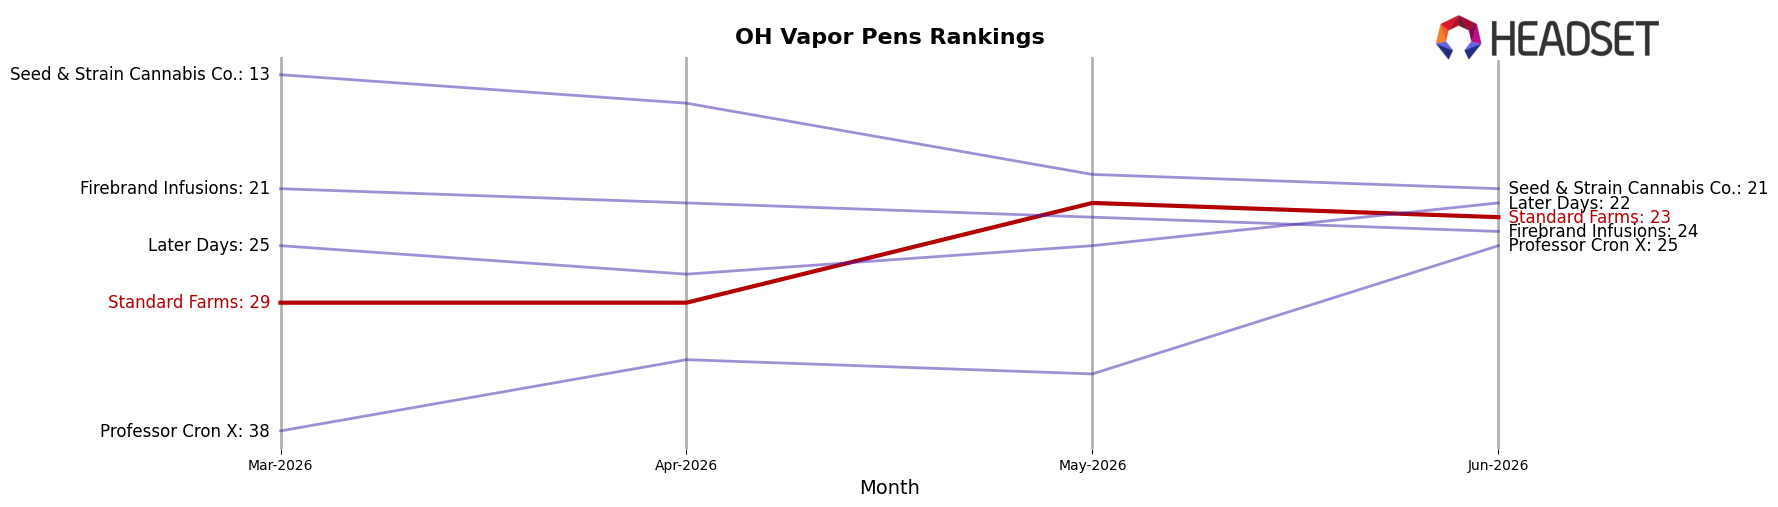
Standard Farms sits at rank #23 in OH Vapor Pens in June 2026, improving 3 positions year over year from #26 and climbing 6 spots since March 2026 from #29, while still trailing its peak of #15 from July 2024 by 8 places; meanwhile, Rove advanced from #10 to #5 alongside a 98.5% year-over-year sales gain and Select moved up from #5 to #4 with 24.1% year-over-year growth, indicating competitors are progressing faster on both rank and velocity—this trajectory implies Standard Farms is stabilizing mid-pack but risks being boxed out of the top 20 unless rank gains accelerate beyond incremental single-digit moves.
Notable Products
NF1 Pre-Roll (1g) posted the steepest decline at -71.32% while dropping to rank 9, and LA Kush Cake Pre-Roll (1g) fell -66.11% at rank 10, together signaling sharp demand attrition at the lower end of the pre-roll lineup. In contrast, Meyer Hashky Pre-Roll (1g) surged +104.80% to rank 1, outpacing Stargazer Distillate Disposable (1g) at rank 3 with a -1.05% slip and creating a bifurcation between a breakout pre-roll and softening vapor pens. Four of the top ten are Vapor Pens clustered at ranks 3–8 alongside four Pre-Rolls spanning ranks 1–10, indicating a barbell mix where a single high-velocity pre-roll and steady mid-pack pens anchor share while secondary pre-rolls contract; this points to reallocating assortment and marketing toward the hero pre-roll and stable disposables rather than breadth across weaker SKUs.
Top Selling Cannabis Brands
Data for this report comes from real-time sales reporting by participating cannabis retailers via their point-of-sale systems, which are linked up with Headset’s business intelligence software. Headset’s data is very reliable, as it comes digitally direct from our partner retailers. However, the potential does exist for misreporting in the instance of duplicates, incorrectly classified products, inaccurate entry of products into point-of-sale systems, or even simple human error at the point of purchase. Thus, there is a slight margin of error to consider. Brands listed on this page are ranked in the top twenty within the market and product category by total retail sales volume.

