Jan-2025
Sales
Trend
6-Month
Product Count
SKUs
Overview
Market Insights Snapshot
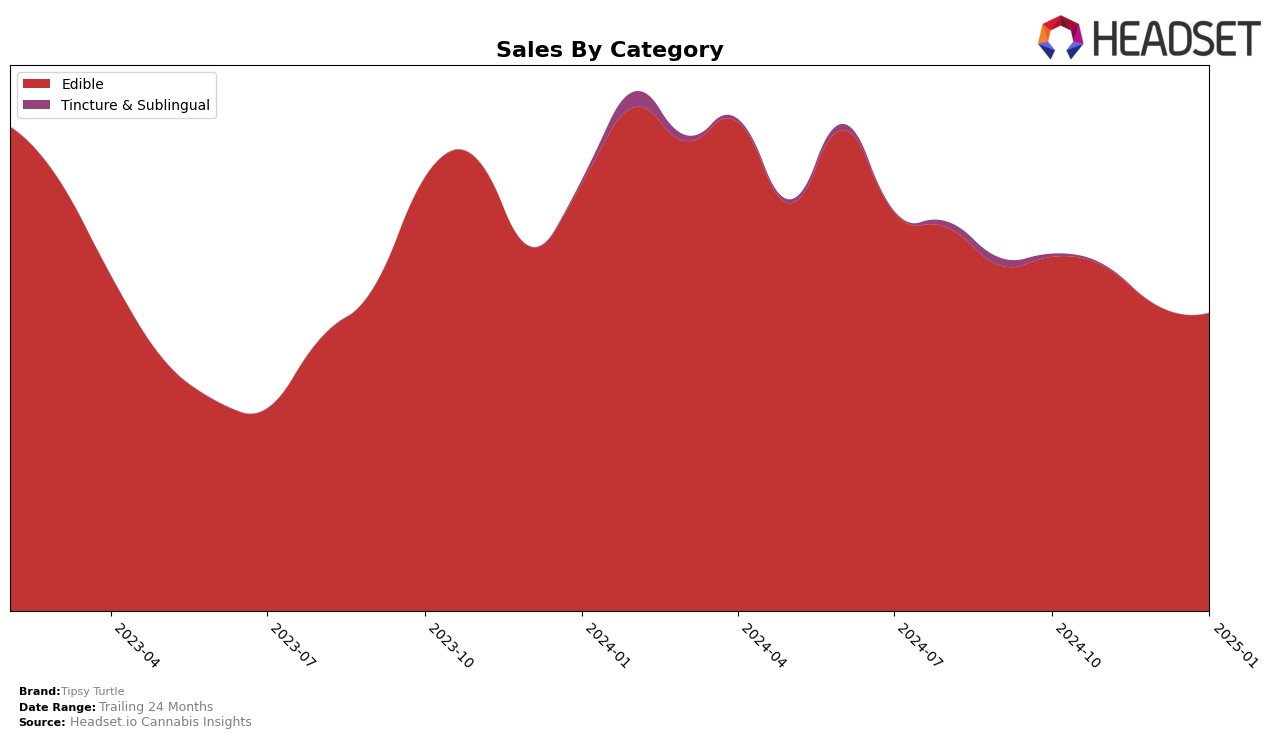
In the state of Arizona, Tipsy Turtle has shown a consistent presence in the Edible category, maintaining a rank of 30 in October and November 2024. However, the brand slipped out of the top 30 in December 2024, only to regain its position by January 2025. This fluctuation suggests that while Tipsy Turtle has a foothold in the Arizona edible market, it faces challenges in maintaining a steady upward trajectory. The decline in sales from October to January indicates potential seasonal effects or increased competition, which might have contributed to the temporary drop in ranking.
Despite the challenges in Arizona, Tipsy Turtle's ability to re-enter the top 30 by January 2025 could be indicative of strategic adjustments or market responses that helped regain its position. The brand's resilience in bouncing back into the rankings highlights its potential to adapt and compete effectively in the market. However, the absence from the top 30 in December raises questions about sustainability and long-term growth strategies, suggesting areas for potential improvement or further analysis.
Competitive Landscape
In the competitive landscape of the Arizona edible cannabis market, Tipsy Turtle has maintained a relatively stable position, ranking 30th in both October 2024 and November 2024, dropping slightly to 32nd in December 2024, and regaining its 30th position by January 2025. This stability is noteworthy, especially when compared to brands like Haze & Main, which experienced a significant drop from 17th in October 2024 to 29th by January 2025. While Tipsy Turtle's sales have seen a gradual decline over the months, this trend is less severe than that of Haze & Main, whose sales plummeted dramatically. Meanwhile, Chew & Chill (C & C) showed a positive trajectory, improving their rank from 37th in October 2024 to 29th in December 2024 before slightly dropping to 32nd in January 2025. This indicates a competitive pressure on Tipsy Turtle to innovate and possibly adjust its marketing strategies to capture a larger market share and improve its ranking in the coming months.

Notable Products
In January 2025, Tipsy Turtle's top-performing product was Sand Dollar Caramel Pecan Chocolate (100mg), reclaiming the number one rank after being in third place the previous month, with sales of 509 units. The CBD/THC 1:2 Salted Caramel Brownie 10-Pack (50mg CBD, 100mg THC) slipped to second place from its top position in December 2024. Salted Caramel Brownie 10-Pack (100mg) maintained a consistent performance, holding the third rank as it did in October 2024. Caramel Nips 10-Pack (100mg) dropped to fourth place, marking a decline from its second-place rank in both October and December 2024. A new entry, Chocolate Covered Pretzels Sticks 10-Pack (100mg), secured the fifth position, indicating a promising start in the product lineup.
Top Selling Cannabis Brands
Data for this report comes from real-time sales reporting by participating cannabis retailers via their point-of-sale systems, which are linked up with Headset’s business intelligence software. Headset’s data is very reliable, as it comes digitally direct from our partner retailers. However, the potential does exist for misreporting in the instance of duplicates, incorrectly classified products, inaccurate entry of products into point-of-sale systems, or even simple human error at the point of purchase. Thus, there is a slight margin of error to consider. Brands listed on this page are ranked in the top twenty within the market and product category by total retail sales volume.


