.svg)

Aug-2026
Sales
Trend
6-Month
Product Count
SKUs
Avg Price
YoY Sales Change
YoY Price Change


Where to Buy
Chew & Chill (C & C) is stocked at 172 licensed dispensaries across Ohio, New York, and 6 other states, 52 of them in Ohio, with the deepest coverage in Columbus, Cincinnati, Dayton, Ashtabula, and Cleveland. Search by ZIP code or city below to find the closest one.
Market Insights Snapshot
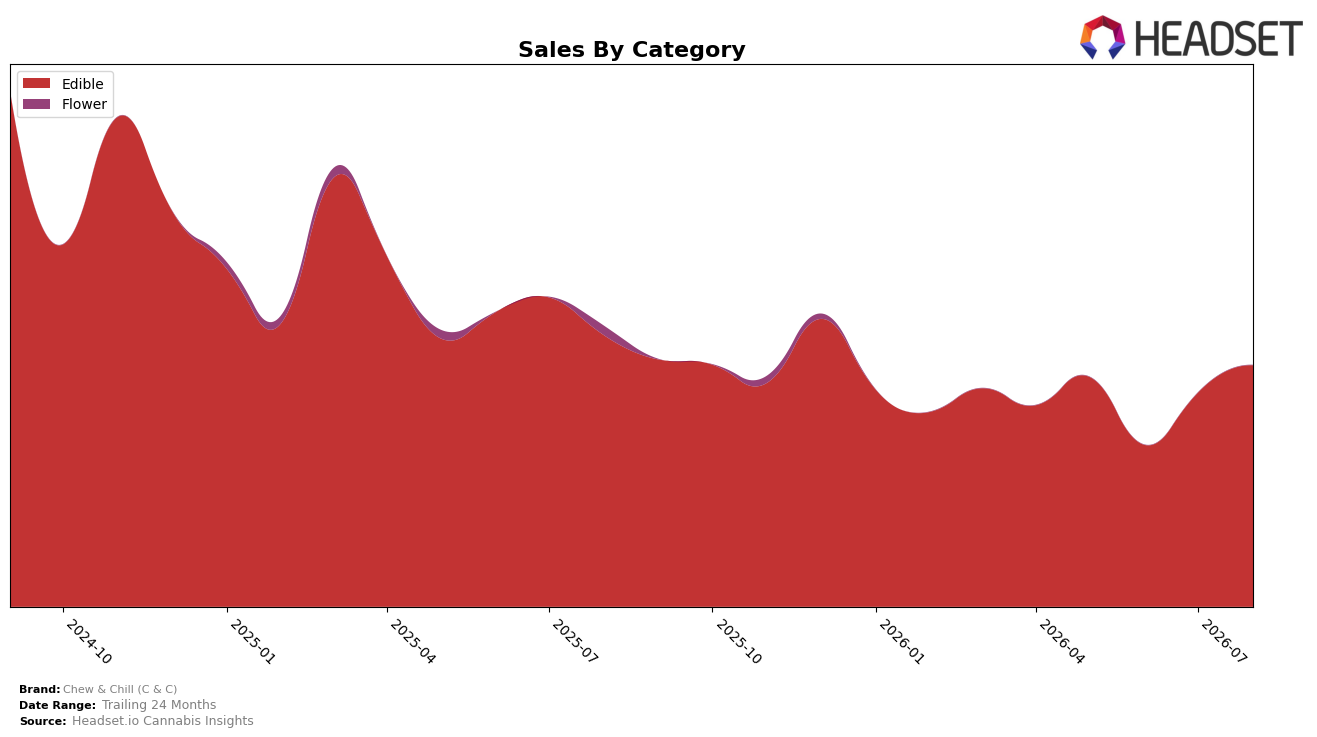
Chew & Chill (C & C) operated as a single-category brand in August 2026, with Edible holding a 100.0% mix, posting a 12.8% month-over-month uptick and an 11.1% year-over-year contraction while average price rose 22.2% year over year. Despite the brand’s overall sales decline of 14.0% year over year and a 61.3% drop over 24 months, Edible’s month-over-month lift suggests volume stabilization against a rising price point, and a rank of 40 in Edible within Ohio implies mid-pack positioning that could be leveraged if the month-over-month momentum persists.
The shift toward higher realized prices alongside a month-over-month sales gain and a year-over-year dip implies trading up within Edibles rather than mix diversification, positioning Chew & Chill (C & C) as a price-accepting Edible specialist rather than a cross-category player. With Edible at 100.0% share and average price at $19.14 amid a 22.2% price increase and an 11.1% year-over-year sales decline, the brand’s August 2026 stance suggests it is competing on differentiated value within Edibles, and the 40 rank in Ohio indicates room to gain rank via price-pack and flavor assortment moves that convert the 12.8% month-over-month growth into sustained share capture.
Competitive Landscape
Chew & Chill (C & C) sits at rank #48 in NY Edible in August 2026, climbing 23 positions from #71 year over year and improving 15 spots from #63 over the last three months; this new peak at #48 in August 2026 places the brand closer to category leaders where Camino edged up from #2 to #1 while Off Hours slipped from #1 to #2 as its sales fell 24.85% year over year, contrasting with Gron / Grön moving from #4 to #3 alongside a 14.77% increase; with leaders like Wyld holding near the top as it shifted from #3 to #4 despite 7.10% YoY growth, the mix of upward mobility at the top and contraction among incumbents suggests that C & C’s 23-rank YoY ascent implies room to capture additional share if it can convert rank momentum into sustained distribution and repeat rates.

Notable Products
Sour Green Apple Live Resin Terp Gummies 10-Pack (500mg) delivered the headline move in August 2026 with a 187% month-over-month surge to rank 3, while Mango Tango Live Resin Gummies 10-Pack (100mg) slid 16% at rank 1 and Jasmine Peach Sugar Free Vegan Live Resin Gummies 10-Pack (100mg) fell 14% at rank 2. CBN/THC 1:2 Tigers Blood Sugar Free Live Resin Gummies 10-Pack (50mg CBN, 100mg THC) climbed 119% to rank 6, contrasting with THC/CBN 5:1 Tigers Blood Live Resin Gummies 10-Pack (50mg CBN, 100mg THC) declining 11% at rank 8, indicating shoppers are favoring higher total potency or sugar-free formats within similar use-cases. Eight of the top ten are Edible SKUs, and two sugar-free SKUs sit in the top 3 alongside one terp-forward 500mg pack, implying formulation variety is concentrating demand at higher potencies despite softness in legacy 100mg leaders. This mix points to Chew & Chill (C & C) leaning into multi-cannabinoid and sugar-free innovation to defend share as flagship 100mg lines contract.
Top Selling Cannabis Brands






Data for this report comes from real-time sales reporting by participating cannabis retailers via their point-of-sale systems, which are linked up with Headset’s business intelligence software. Headset’s data is very reliable, as it comes digitally direct from our partner retailers. However, the potential does exist for misreporting in the instance of duplicates, incorrectly classified products, inaccurate entry of products into point-of-sale systems, or even simple human error at the point of purchase. Thus, there is a slight margin of error to consider. Brands listed on this page are ranked in the top twenty within the market and product category by total retail sales volume.

