Oct-2025
Sales
Trend
6-Month
Product Count
SKUs
Avg Price
YoY Sales Change
YoY Price Change
Market Insights Snapshot
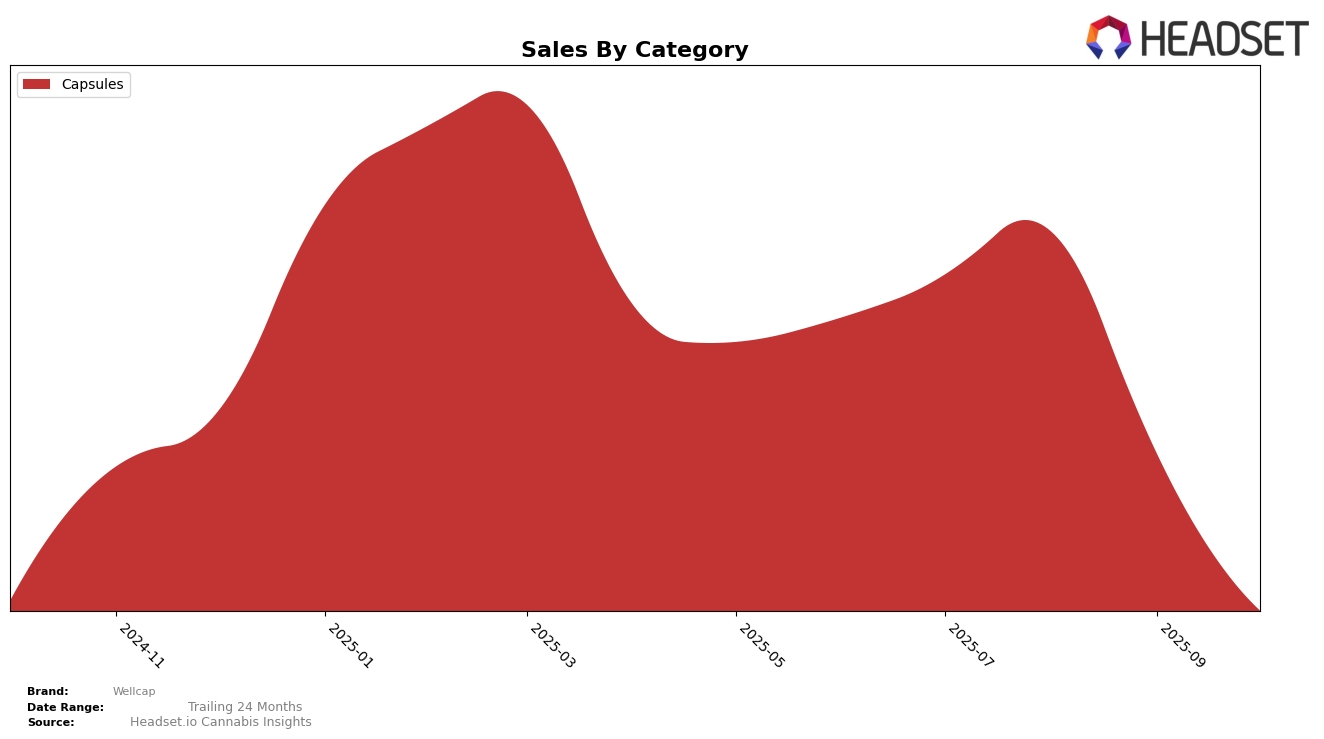
In the state of Massachusetts, Wellcap has shown a consistent performance in the Capsules category, maintaining a steady rank of 3rd in both July and August 2025. This suggests a strong foothold in the market segment, with sales figures indicating a positive trajectory from July to August. However, it is noteworthy that Wellcap did not appear in the top 30 rankings for September and October, which could indicate a shift in consumer preferences or increased competition, potentially impacting their market share.
Wellcap's absence from the top 30 rankings in Massachusetts for the months of September and October might be a signal of challenges they are facing in sustaining their market position. This drop could be attributed to various factors, such as new entrants in the market or changes in consumer demand dynamics. The decline in visibility in the rankings highlights the importance of strategic adjustments to regain momentum and competitiveness in the Capsules category. Observing these patterns can provide insights into the evolving landscape of the cannabis market and the need for brands like Wellcap to adapt to maintain their standing.
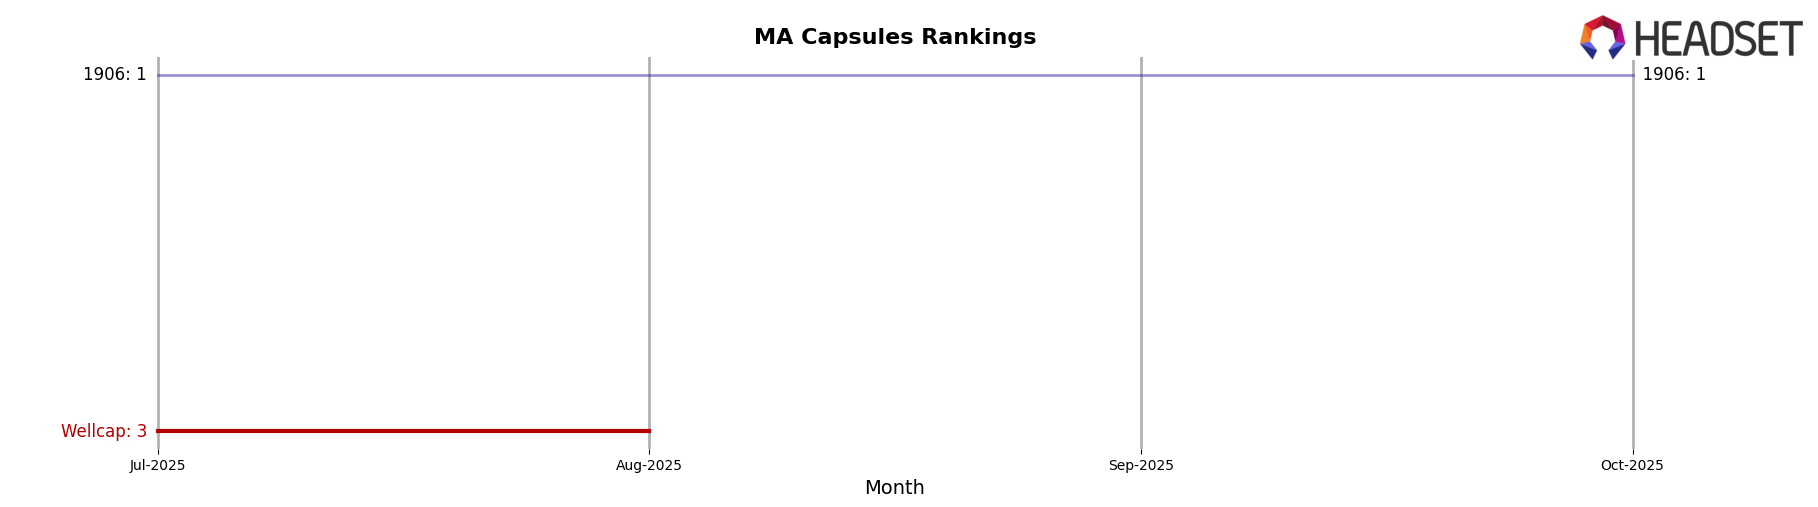
Competitive Landscape
In the Massachusetts capsules market, Wellcap has maintained a consistent rank of 3rd place in both July and August 2025, but it has not appeared in the top 20 rankings for September and October 2025. This suggests a significant drop in its market presence during the latter months, which could be attributed to changes in consumer preferences or increased competition. Notably, 1906 has held the top position consistently from July to October 2025, indicating a strong and stable market dominance. This competitive landscape suggests that Wellcap may need to reassess its strategies to regain its position and address the factors contributing to its decline in rank and sales in the Massachusetts capsules category.
Notable Products
In October 2025, the top-performing product from Wellcap was the THCV/THC 1:1 Activate Gel Capsules 20-Pack, which secured the number one spot in the rankings. This product showed a significant climb from fourth place in July to the top position in October, despite a decrease in sales to 75 units. The THC/CBG/CBN/CBD/THCV 2:1:1:1:1 Harmony Gel Capsules 20-Pack, previously holding the top rank in August and September, moved to second place in October. The Anytime Gel Capsules 20-Pack, which did not rank in October, had been steadily climbing each month from July to September. The CBN/THC 2:1 Wind Down Gel Capsules and THC/THCV/CBN 2:1:1 Activate / Wind Down Capsules did not make October's rankings, indicating a shift in consumer preferences.
Top Selling Cannabis Brands
Data for this report comes from real-time sales reporting by participating cannabis retailers via their point-of-sale systems, which are linked up with Headset’s business intelligence software. Headset’s data is very reliable, as it comes digitally direct from our partner retailers. However, the potential does exist for misreporting in the instance of duplicates, incorrectly classified products, inaccurate entry of products into point-of-sale systems, or even simple human error at the point of purchase. Thus, there is a slight margin of error to consider. Brands listed on this page are ranked in the top twenty within the market and product category by total retail sales volume.

