.svg)

Sep-2026
Sales
Trend
6-Month
Product Count
SKUs
Avg Price
YoY Sales Change
YoY Price Change


Where to Buy
1906 is stocked at 674 licensed dispensaries across New York, Oklahoma, and 4 other states, 206 of them in New York, with the deepest coverage in New York, Brooklyn, Queens, Schenectady, and Syracuse. Search by ZIP code or city below to find the closest one, or filter by product type if you are after a specific format.
Market Insights Snapshot
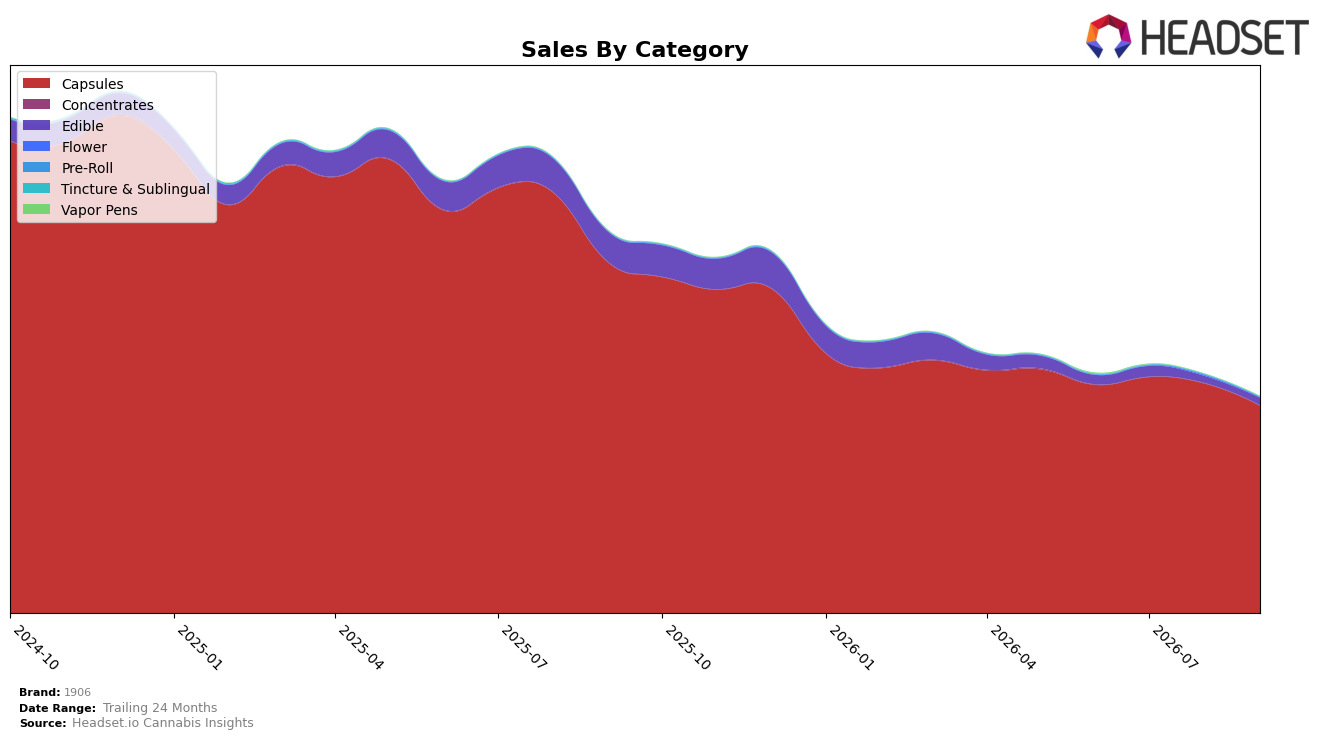
In September 2026, Capsules held 96.63% share for 1906 with year-over-year sales down 40.94% and month-over-month down 9.72%, while Edible accounted for 3.37% with a 75.81% year-over-year decline but an 8.66% month-over-month uptick; Pre-Roll was negligible at 0.00% share with a 30.09% year-over-year drop and an 83.07% month-over-month fall. The average price fell 7.67% year-over-year to $19.40 alongside a brand-level sales decline of 43.67% year-over-year and 60.03% over 24 months, and Capsules’ average price at $19.23 versus Edible at $26.28 reinforces a price gap. The pattern implies 1906 is concentrated in Capsules and absorbing category-wide pressure, with a small Edible rebound month-over-month not yet large enough to offset double-digit Capsules contraction.
Capsules dominance at 96.63% share paired with a number 1 rank in Capsules in Illinois and a 9.72% month-over-month decline indicates reliance on a single category that is shrinking faster month-over-month than the nascent Edible line’s 8.66% gain can counter, and Pre-Roll’s 83.07% month-over-month drop offers no diversification relief. With brand-wide average price down 7.67% year-over-year and Capsules down 40.94% year-over-year versus Edible down 75.81% year-over-year, the mix skews toward lower-priced Capsules while the higher-priced Edible tier remains too small at 3.37% share to lift revenue density. This positioning implies 1906 is optimized for Capsule share but under-indexed on growth insurance, so near-term stability depends on slowing the Capsules decline or scaling Edible share by multiple points while maintaining the price gap.
Competitive Landscape
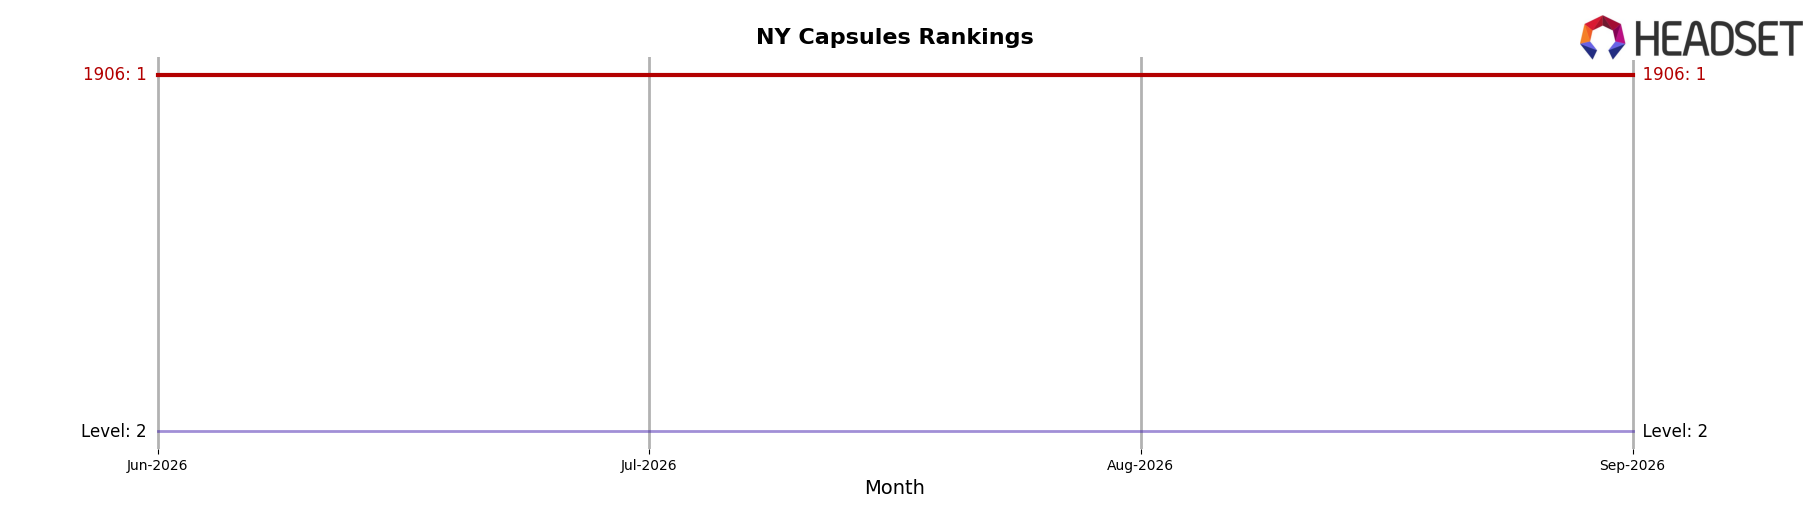
1906 ranks #1 in NY Capsules in September 2026, unchanged from #1 a year earlier, while it also held #1 three months ago, indicating zero rank volatility alongside a peak rank of #1 in September 2026; in contrast, Level sits at #2 with a -4.7% year-over-year sales decline and Canna Clinicals slipped from #3 to #4 with an -18.7% decline, and Revival moved from #4 to #5 with a -15.1% decline, reinforcing a spread where rivals are losing momentum as 1906 holds the top slot; the pattern implies that sustained #1 positioning with no year-over-year or three-month rank drift, while adjacent competitors move down one rank position and post double-digit declines, points to entrenched category leadership rather than transient outperformance.
Notable Products
The steepest movement in September 2026 is the decline for CBD/THC 1:1 Bliss Tablets 20-Pack (100mg CBD, 100mg THC), down 23.0% month over month while sliding behind Boost Drops Pills 20-Pack (100mg) at rank 2 versus rank 1 leadership for Boost. Boost Drops Pills 20-Pack (100mg) rose 7.9% MoM to hold rank 1, and CBD/THC 5:1 Chill Pill Tablets 20-Pack (500mg CBD, 100mg THC) fell 12.0% at rank 3, signaling a pivot away from higher-CBD balance toward the flagship stimulant SKU at the top. With eight of the top ten SKUs in Capsules and only one SKU posting positive MoM above 5% while two fell worse than -10%, the assortment is concentrated and skewed to a single growth engine, implying 1906 is leaning on Boost to carry a Capsules-heavy portfolio rather than broad-based momentum.
Top Selling Cannabis Brands






Data for this report comes from real-time sales reporting by participating cannabis retailers via their point-of-sale systems, which are linked up with Headset’s business intelligence software. Headset’s data is very reliable, as it comes digitally direct from our partner retailers. However, the potential does exist for misreporting in the instance of duplicates, incorrectly classified products, inaccurate entry of products into point-of-sale systems, or even simple human error at the point of purchase. Thus, there is a slight margin of error to consider. Brands listed on this page are ranked in the top twenty within the market and product category by total retail sales volume.

