.svg)

Sep-2026
Sales
Trend
6-Month
Product Count
SKUs
Avg Price
YoY Sales Change
YoY Price Change


Where to Buy
Yummi Karma is stocked at 193 licensed dispensaries across California, with the deepest coverage in Los Angeles, San Francisco, Corona, Long Beach, and San Bernardino. Search by ZIP code or city below to find the closest one.
Market Insights Snapshot
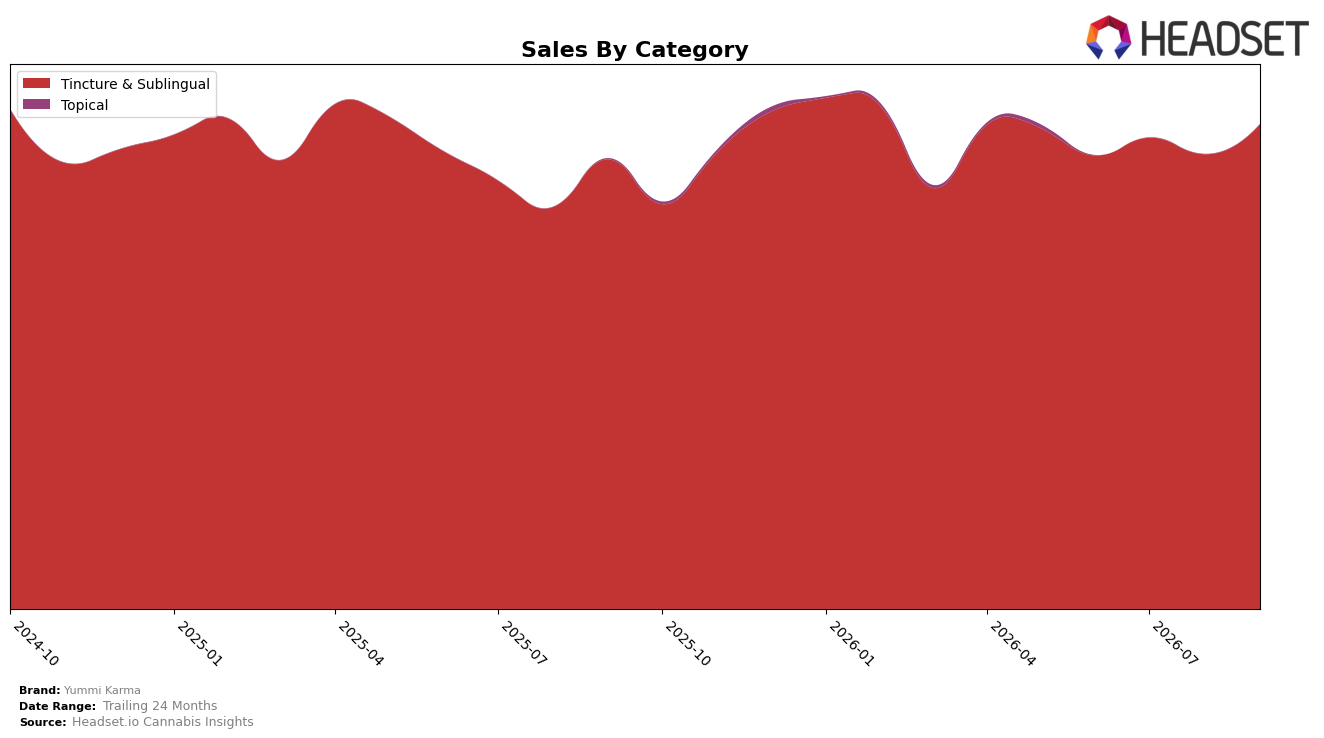
Yummi Karma operated as a single-category brand in September 2026, with Tincture & Sublingual accounting for 100.0% of sales and posting a 7.8% year-over-year uplift alongside a 6.6% month-over-month gain; in parallel, average price declined 5.1% year over year while overall brand sales rose 7.6% year over year. Within California Tincture & Sublingual, the brand held rank 2 for the month, and its month-over-month category growth of 6.6% outpaced the price contraction, implying volume expansion. The pattern implies Yummi Karma is deepening its specialization in Tincture & Sublingual while trading price for share and rank stability at the premium end of a concentrated portfolio.
With a single-category mix at 100.0% and a rank of 2 in California Tincture & Sublingual, the 5.1% year-over-year price decline paired with 7.6% brand sales growth points to elasticity that is currently favorable, while the 6.6% month-over-month lift suggests short-cycle demand is responsive to pricing or promotional cadence. This configuration implies Yummi Karma’s positioning is anchored in value-accessible tinctures that can defend a top-3 slot even as prices compress, but it also concentrates risk in a single format where sustaining rank 2 will require continued volume gains of at least mid–single digits when price trends are negative.
Competitive Landscape
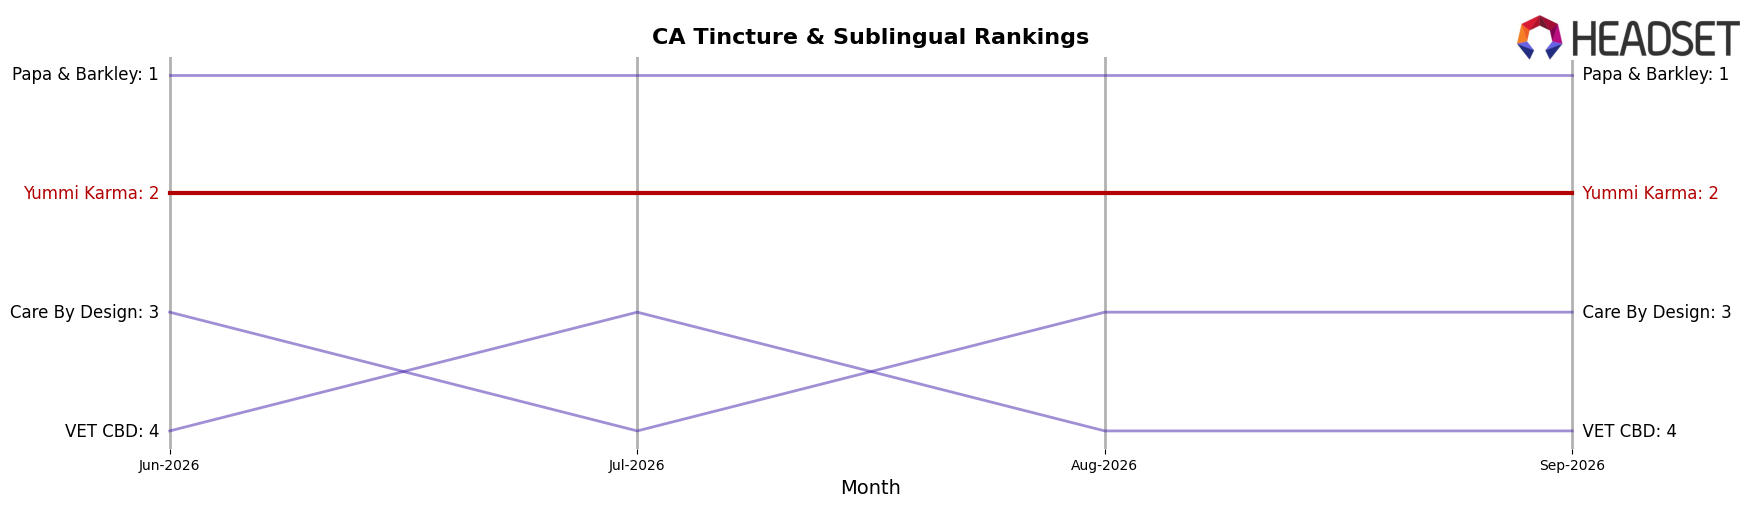
Yummi Karma sits at rank #2 in California Tincture & Sublingual for September 2026, unchanged from rank #2 in September 2025, and it has also held #2 for the last three months, while its peak rank of #2 coincides with September 2026; in contrast, Papa & Barkley holds #1 both this month and a year ago despite a -8.4% year-over-year sales decline, and Care By Design remains at #3 year-over-year with a -23.9% sales change. Further down the leaderboard, VET CBD stays at #4 with a -1.8% year-over-year shift, while Mary's Medicinals rose from #7 to #5 alongside a 22.3% sales increase, signaling upward pressure from below; given Yummi Karma’s flat rank at #2 alongside mixed competitor trajectories, the pattern implies a stable but capped position that will require displacement of a weakening #1 or defense against a faster-rising #5 to change its rank trajectory.
Notable Products
CBD/CBN/THC 8:10:2 Tasty Taro Tincture (240mg CBD, 300mg CBN, 60mg THC, 30ml, 1oz) delivered the largest month-over-month surge at 46.7% while Lights Out Marshmallow Natural Sleep Tincture (1000mg THC, 30ml) inched up only 2.6% but held rank 1. Drift Away Bedtime Tincture (300mg THC, 30ml) advanced 15.9% to rank 2, whereas CBD/THC 30:1 Just Peachy Tincture (1000mg CBD, 30mg THC, 30ml) dipped 3.2% and sat behind higher-THC and sleep-oriented SKUs. With all top-10 items in Tincture & Sublingual and over half anchored in sleep or nighttime positioning, the mix indicates Yummi Karma is consolidating around high-THC and sleep-benefit tinctures, with premium sleep SKUs monetizing the category lead off a $124,244 anchor from Lights Out Marshmallow.
Top Selling Cannabis Brands






Data for this report comes from real-time sales reporting by participating cannabis retailers via their point-of-sale systems, which are linked up with Headset’s business intelligence software. Headset’s data is very reliable, as it comes digitally direct from our partner retailers. However, the potential does exist for misreporting in the instance of duplicates, incorrectly classified products, inaccurate entry of products into point-of-sale systems, or even simple human error at the point of purchase. Thus, there is a slight margin of error to consider. Brands listed on this page are ranked in the top twenty within the market and product category by total retail sales volume.

