Jun-2026
Sales
Trend
6-Month
Product Count
SKUs
Avg Price
YoY Sales Change
YoY Price Change
Market Insights Snapshot
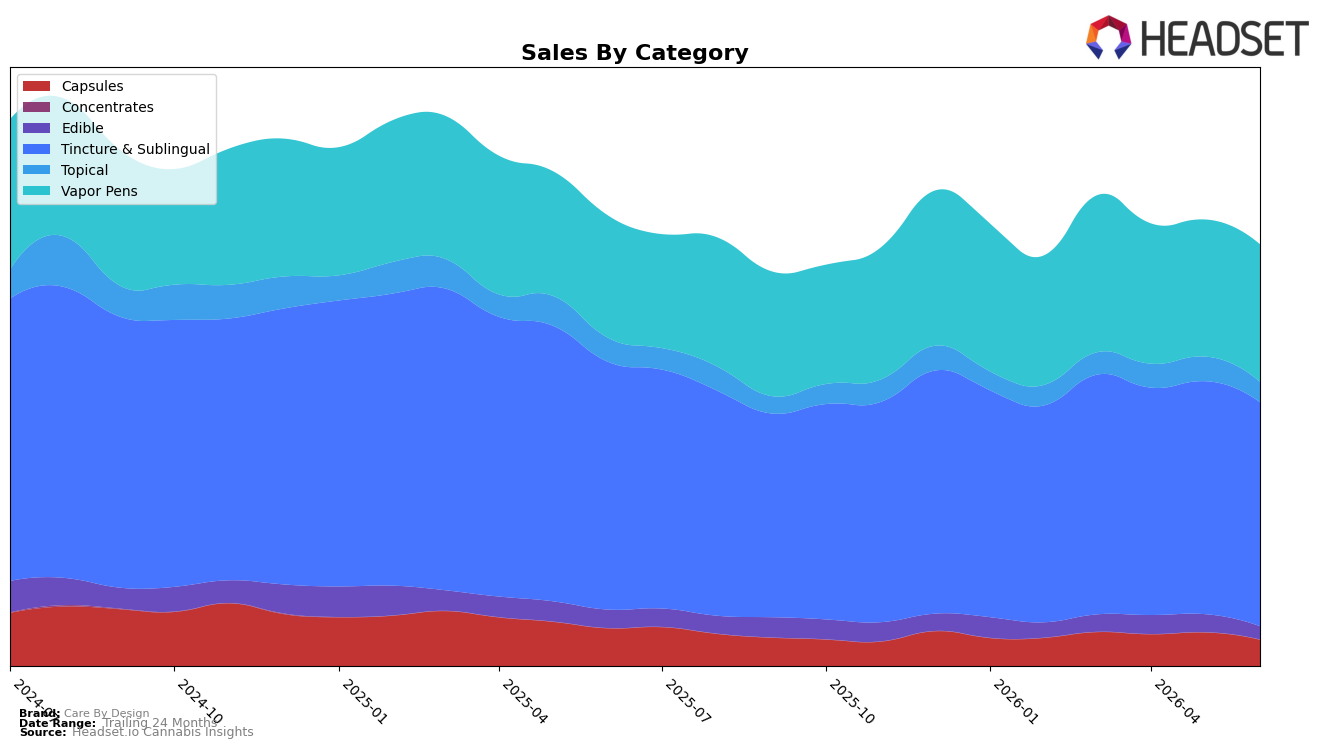
In June 2026, Care By Design’s mix remained anchored in Tincture & Sublingual at 53.19% share with a -9.59% year-over-year decline and a -3.86% month-over-month dip, while Vapor Pens expanded to 32.64% share on +12.47% year-over-year growth and a +0.30% month-over-month uptick. Smaller formats contracted sharply: Capsules fell -30.25% year-over-year and -21.65% month-over-month to 6.28% share, Topical declined -14.99% year-over-year and -17.19% month-over-month to 4.79% share, and Edible dropped -28.36% year-over-year and -26.66% month-over-month to 3.10% share. With average price down -3.30% year-over-year to $36.39 and Tincture & Sublingual still ranked #3 in California, the pattern implies the brand is leaning on its core tincture position while gradually reallocating demand toward Vapor Pens to offset broad softness in peripheral categories.
The mix shift toward Vapor Pens (+12.47% year-over-year; +0.30% month-over-month) alongside declines in Capsules (-30.25% year-over-year; -21.65% month-over-month) and Edible (-28.36% year-over-year; -26.66% month-over-month) implies a consumer pivot toward faster-acting inhalable use cases and away from wellness-adjacent or value-seeking formats as prices ease -3.30% year-over-year. Holding a #3 rank in Tincture & Sublingual within California while that category slips -9.59% year-over-year and -3.86% month-over-month suggests brand equity in the legacy format remains an asset, but the improving Vapor Pens contribution at 32.64% share signals a need to re-balance assortment and pricing to capture repeatable inhalable demand without eroding the high-share tincture franchise.
Competitive Landscape
Care By Design ranks #3 in California Tincture & Sublingual for June 2026, unchanged from #3 year over year, while its peak of #1 in February 2025 contrasts with a flat three-month hold at #3; in the same period, Papa & Barkley held #1 with a -9.7% YoY sales change and Yummi Karma stayed #2 with a +3.3% YoY sales change, positioning Care By Design as stable in rank but ceding momentum to a competitor that is growing and another that is contracting. Compared with VET CBD at #4 with a -7.6% YoY shift and ABX / AbsoluteXtracts improving rank from #7 to #5 alongside +10.3% YoY growth, the unchanged #3 rank and the gap from a prior #1 peak imply a plateau: absent a share-accretive move, Care By Design is more likely to be pressured from below than to displace #2 or #1 in the next two quarters.

Notable Products
CBD/THC 40:1 Low THC Tincture (480mg CBD, 12mg THC, 15ml) posted the steepest decline at -24.5% and slid to rank 5, while CBD/THC 1:1 MAX Peppermint Full Spectrum Tincture (1000mg CBD, 1000mg THC, 15ml) fell -10.8% but held rank 1. In contrast, CBD/THC 2:1 Higher THC Full Spectrum Cartridge (1g) climbed +24.6% into rank 9 as CBD/THC 1:1 Higher THC Full Spectrum Cartridge (1g) dropped -11.9% to rank 6, indicating a shift within the Vapor Pens mix toward mid-THC ratios. With four of the top ten in Vapor Pens and three in Tincture & Sublingual, share is tilting toward inhalables as value concentrates near balanced or higher-THC ratios rather than ultra-low THC formats. The pattern implies Care By Design is pivoting product momentum from low-THC wellness tinctures toward functional, ratio-balanced inhalables that can scale velocity.
Top Selling Cannabis Brands
Data for this report comes from real-time sales reporting by participating cannabis retailers via their point-of-sale systems, which are linked up with Headset’s business intelligence software. Headset’s data is very reliable, as it comes digitally direct from our partner retailers. However, the potential does exist for misreporting in the instance of duplicates, incorrectly classified products, inaccurate entry of products into point-of-sale systems, or even simple human error at the point of purchase. Thus, there is a slight margin of error to consider. Brands listed on this page are ranked in the top twenty within the market and product category by total retail sales volume.

