Market Insights Snapshot
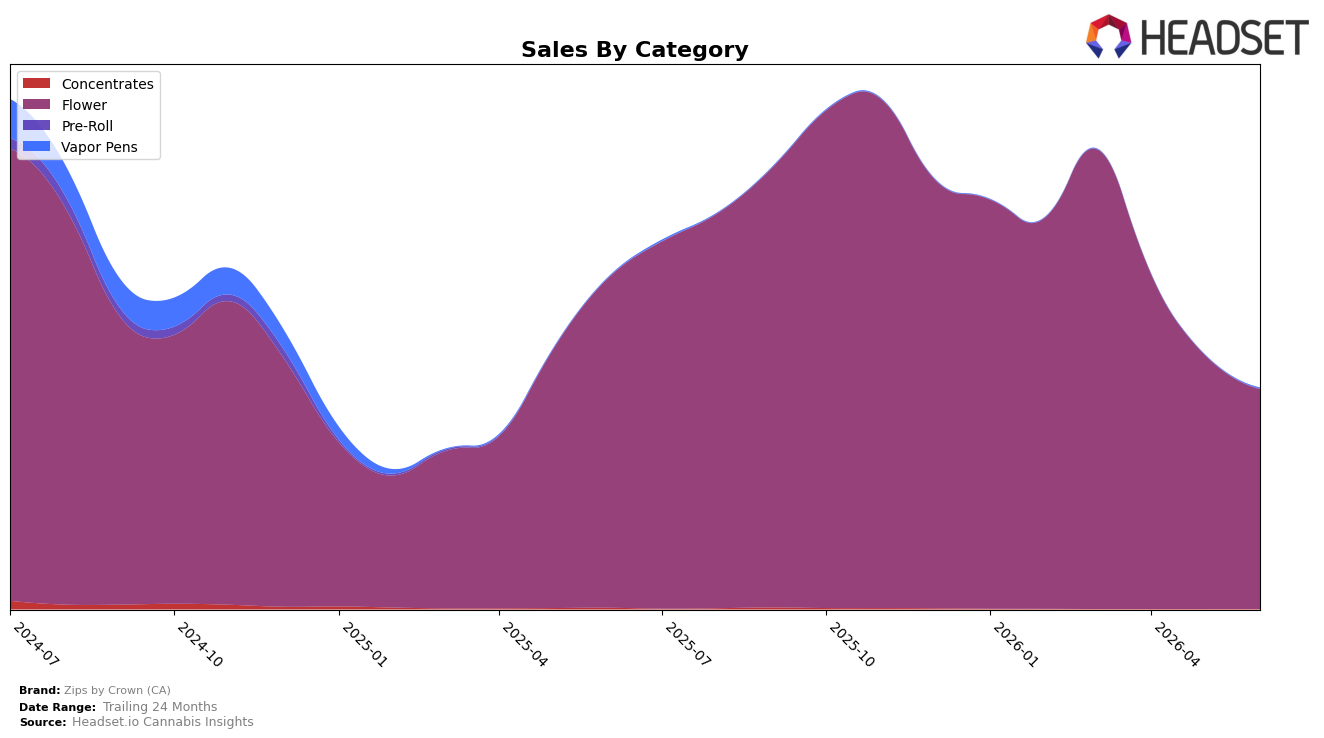
In June 2026, Zips by Crown (CA) concentrated 99.72% of sales in Flower while Vapor Pens held 0.28% share, indicating a near-single-category footprint. Within Flower, year-over-year sales declined 33.32% and month-over-month fell 13.46%, while the overall brand sales year-over-year change was -33.47%, tying brand trajectory tightly to Flower’s downturn; at the same time, average price rose 19.89% year-over-year to $104.51, diverging from volume trends. Vapor Pens grew 65.20% year-over-year off a small base and carried an average price of $15.36, but the sub-1% share limits impact; the brand’s Flower rank in New Jersey was 19, framing current placement within the category. The pattern implies overexposure to Flower magnifies downside from price-mix shifts and rank pressure, while nascent Vapor Pens growth is not yet sized to offset category concentration risk.
With Flower at 99.72% share and a 13.46% month-over-month decline versus a 65.20% year-over-year increase in Vapor Pens that still accounts for only 0.28% share, the brand’s mix limits the benefit of adjacency growth and anchors performance to Flower volatility. A 19.89% year-over-year price increase alongside a -33.32% year-over-year Flower sales change and a 19th-place Flower rank in New Jersey signals that trading up has not translated to rank gains, implying elasticity and shelf competitiveness headwinds. The implication is that near-term positioning depends on mitigating Flower-driven declines through price-pack architecture or selective mix diversification, because current rank 19 leaves limited buffer if Flower continues to contract while Vapor Pens’ growth remains too small to materially shift share.
Competitive Landscape
Zips by Crown (CA) sits at rank #19 in June 2026, improving 4 spots year over year from #23 but falling 11 positions since March 2026 when it peaked at #8, indicating a mid-year pullback after a first-quarter surge; meanwhile, Find. climbed from #12 to #1 with a 226% year-over-year sales increase while Ozone held at #2 despite an 11% year-over-year sales decline, a contrast that suggests leadership is consolidating at the top as Zips by Crown (CA)’s trajectory points to momentum loss after a brief ascent.

Notable Products
The steepest movement in June 2026 is the decline for Garden City (28g), down 9.3% month over month while sliding to rank 2, contrasted with Cheetah Haze (3.5g) jumping 49.8% MoM to take rank 1. Eight of the top ten are 28g Flower SKUs, indicating a bulk-size concentration even as the lone 3.5g winner captured the top spot; this tilt implies reliance on large-format velocity with a tactical opening for premium eighths.
Cheetah Haze (3.5g) now leads at rank 1 with its 49.8% MoM lift, while Garden City (28g) sits at rank 2 after a 9.3% pullback, and Modern Marvel (28g) holds rank 4 with $50,357 in June sales. The pattern implies Zips by Crown (CA) is anchored in 28g Flower for volume but is testing demand elasticity where a standout 3.5g can quickly convert share at the very top of the lineup.
Top Selling Cannabis Brands
Data for this report comes from real-time sales reporting by participating cannabis retailers via their point-of-sale systems, which are linked up with Headset’s business intelligence software. Headset’s data is very reliable, as it comes digitally direct from our partner retailers. However, the potential does exist for misreporting in the instance of duplicates, incorrectly classified products, inaccurate entry of products into point-of-sale systems, or even simple human error at the point of purchase. Thus, there is a slight margin of error to consider. Brands listed on this page are ranked in the top twenty within the market and product category by total retail sales volume.

