Jun-2026
Sales
Trend
6-Month
Product Count
SKUs
Avg Price
YoY Sales Change
YoY Price Change
Market Insights Snapshot
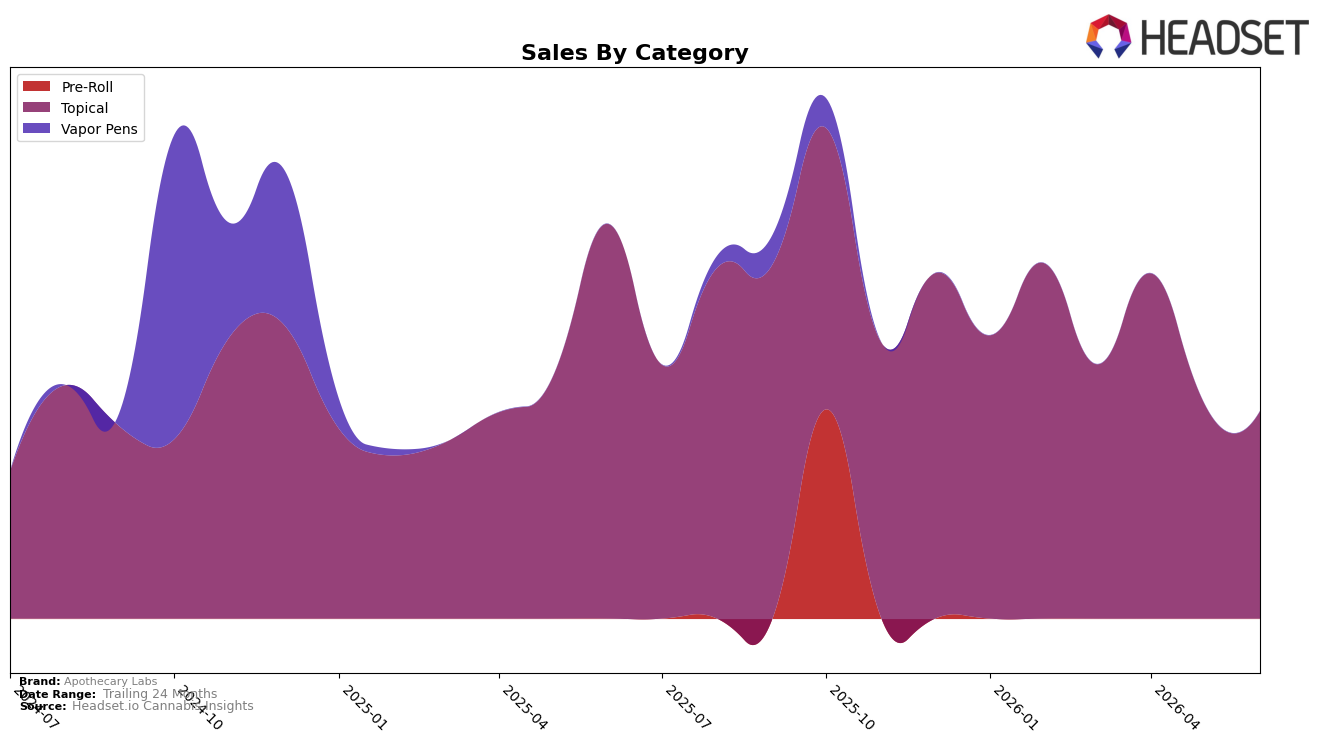
In June 2026, Apothecary Labs concentrated entirely in Topical, with Topical holding 100.0% share and declining by 47.47% year over year while slipping 3.27% month over month; the average price rose 20.56% YoY to $35.68. With no diversification beyond Topical and no rank reported in British Columbia, the combination of a double-digit price increase alongside a 47.47% YoY sales drop and a 3.27% MoM dip implies the current mix is exposed to price-sensitive demand within a single-category footprint.
The shift toward higher realized pricing (+20.56% YoY) amid a 47.47% YoY decline and 3.27% MoM slippage suggests Apothecary Labs is trading into a narrower Topical niche where elasticity is biting and volume is the pressure point; with 100.0% category concentration, the brand’s positioning skews toward premiumized Topical rather than balanced portfolio defense. The absence of a June 2026 rank in British Columbia together with single-category dependence indicates the path forward likely requires either margin-led focus within Topical or diversification to buffer the 47.47% YoY contraction and curb the continued 3.27% MoM erosion.
Competitive Landscape
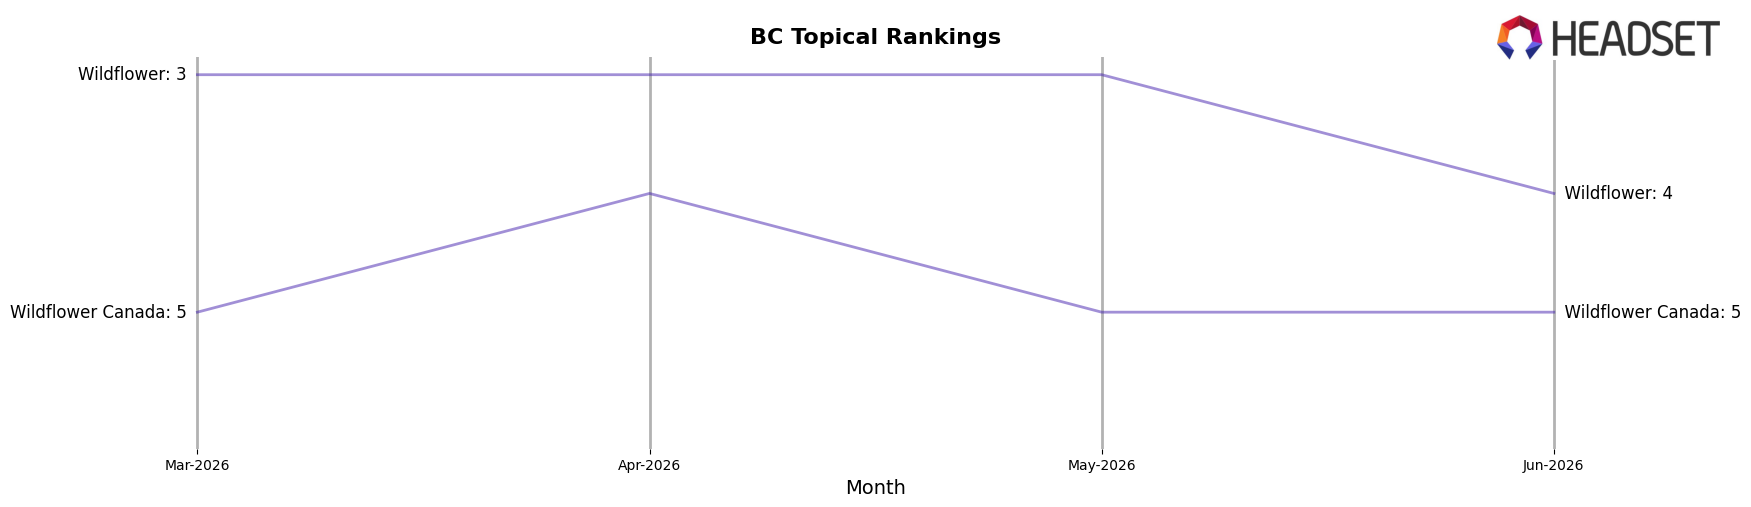
Apothecary Labs sits at rank #6 in BC Topical for June 2026, up 2 positions year over year from #8 and unchanged versus March 2026 at #6, while category leaders shifted more sharply: Stewart Farms moved from #3 to #2 and Wildflower climbed from #5 to #4 as Wildflower Canada fell from #2 to #5. With Proofly holding #1 both this year and last and Nutra improving from #4 to #3, the pattern indicates Apothecary Labs’ incremental rise of 2 ranks amid competitor churn suggests a stable foothold that will require displacement of adjacent brands to progress beyond its current peak at #6.
Notable Products
CBD Maximum Strength Roll-On Gel (2000mg CBD, 88g) set the tone in June 2026 with a rank of 1 despite a -4.8% month-over-month decline, while CBD Maximum Strength Mini Roll-On Gel (1000mg CBD) entered at rank 2 with no prior-month baseline. With both top-2 SKUs in Topical, the category concentration suggests a tilt toward pain-relief formats even as the leader softened by -4.8% and the runner-up’s ranking leapfrogged legacy items by entering directly at 2. The pattern implies Apothecary Labs is consolidating demand around high-potency topicals, prioritizing depth in a single category over breadth.
Top Selling Cannabis Brands
Data for this report comes from real-time sales reporting by participating cannabis retailers via their point-of-sale systems, which are linked up with Headset’s business intelligence software. Headset’s data is very reliable, as it comes digitally direct from our partner retailers. However, the potential does exist for misreporting in the instance of duplicates, incorrectly classified products, inaccurate entry of products into point-of-sale systems, or even simple human error at the point of purchase. Thus, there is a slight margin of error to consider. Brands listed on this page are ranked in the top twenty within the market and product category by total retail sales volume.

