Jun-2026
Sales
Trend
6-Month
Product Count
SKUs
Avg Price
YoY Sales Change
YoY Price Change
Market Insights Snapshot
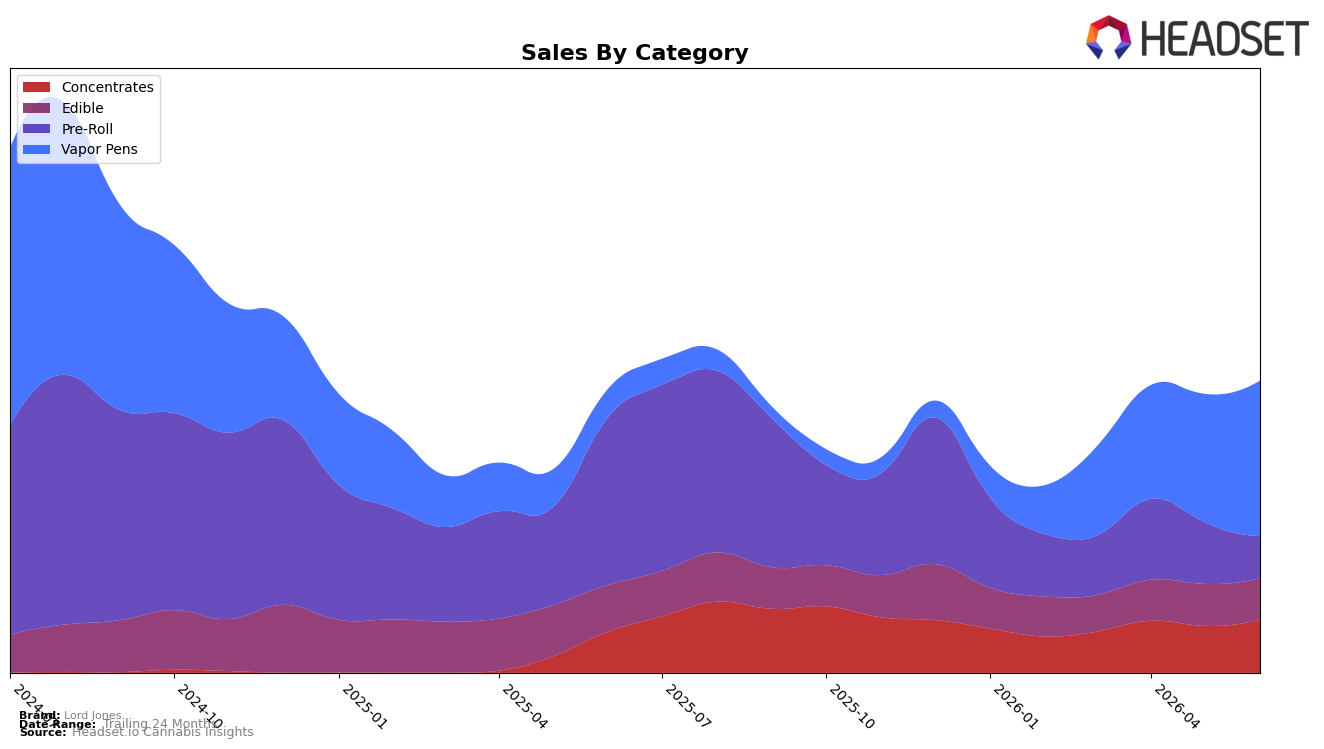
Vapor Pens expanded to 53.31% share with 449.87% year-over-year growth and 21.38% month-over-month, while Concentrates rose to 18.20% share on 29.56% YoY and 13.25% MoM. In contrast, Pre-Roll contracted to 14.40% share with -74.95% YoY and -31.90% MoM, and Edible held 14.09% share with -11.92% YoY and -1.47% MoM. Average price rose 20.30% YoY to $19.23 even as brand sales grew only 2.86% YoY, and Vapor Pens’ average price of 36.75 sits well above Edible at 5.38. The mix shift toward higher-price Vapor Pens and Concentrates alongside steep Pre-Roll and Edible declines implies a deliberate pivot into inhalables where Lord Jones can trade on premium pricing while exiting lower-price volume plays.
With Vapor Pens now the top category and a rank of 23 in Vapor Pens in Saskatchewan, the category tilt signals where Lord Jones competes most directly, as the 21.38% MoM surge in Vapor Pens and 13.25% MoM in Concentrates offset a -31.90% MoM drag from Pre-Roll. The 449.87% YoY gain in Vapor Pens combined with a -11.92% YoY decline in Edible indicates margin mix is improving even if total sales are up only 2.86% YoY, and a 37.89% decline over 24 months points to a smaller, more focused portfolio. The implication is that positioning should center on inhalable efficacy and premium tiers, using Vapor Pens leadership share of 53.31% and Concentrates at 18.20% to anchor assortment while de-emphasizing underperforming Pre-Roll and value-oriented Edible.
Competitive Landscape
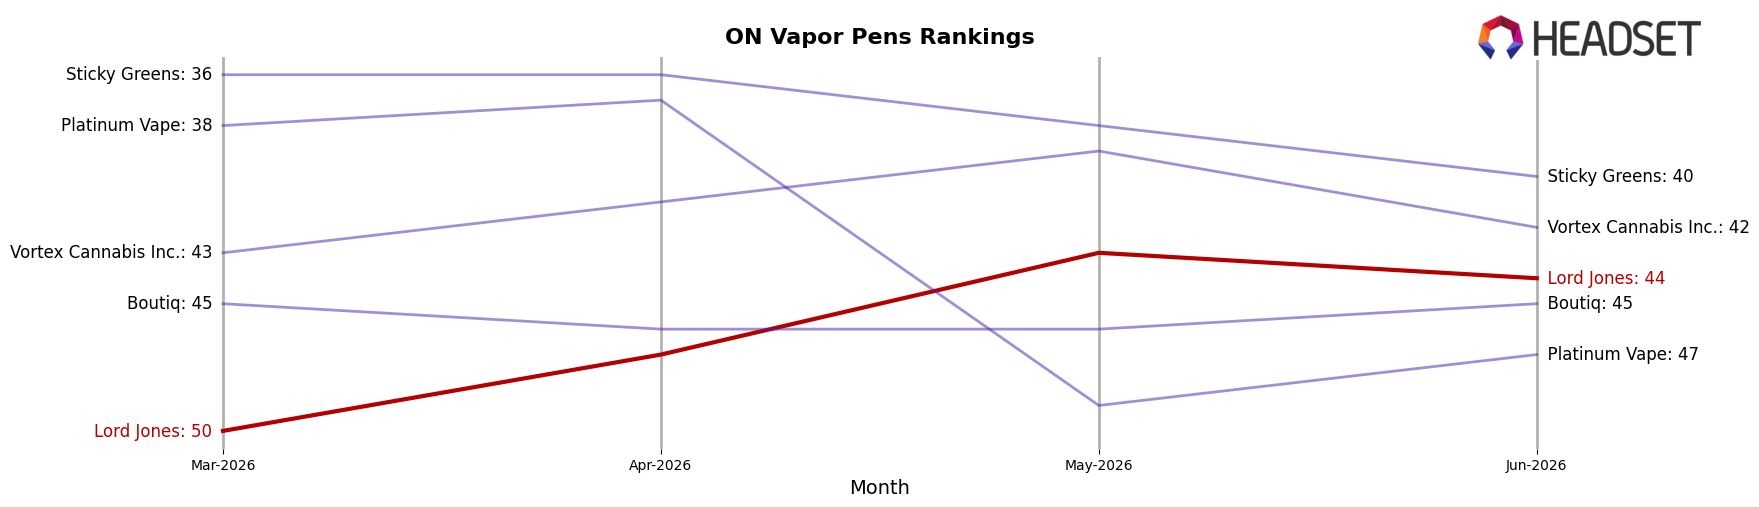
Lord Jones sits at rank 44 in ON Vapor Pens for June 2026, improving 36 positions from rank 80 year over year, and gaining 6 spots from rank 50 in March 2026; however, the brand remains 21 places below its peak rank of 23 from August 2024. In contrast, Spinach moved up from rank 5 to rank 1 while growing sales 173.8% year over year, and BoxHot slipped from rank 1 to rank 3 alongside a 22.1% sales decline, indicating a reshuffling at the top that has not yet translated into top-30 access for Lord Jones despite recent upward momentum. The pattern implies Lord Jones’s rank trajectory is a mid-pack recovery that narrows the YoY gap but requires further share capture to break back toward its August 2024 ceiling.
Notable Products
The steepest movement in June 2026 is the -20.5% drop for Orange Velvet Live Resin Caviar (1g), which sits at rank 8 while Vapor Pens like Sour Blueberry Liquid Diamonds Live Cartridge (1g) surged +58.4% to rank 4. CBD/THC 1:1 Salted Caramel Crunch Fusions Chocolate 5-Pack (10mg CBD, 10mg THC) retained rank 1 with +9.5% MoM while the related CBN/CBD/THC 1:1:1 Fudge Brownie Fusion Bite 5-Pack (10mg CBN, 10mg CBD, 10mg THC) fell -15.5% at rank 7, indicating divergence within Edibles. Three of the top five are Vapor Pens, and Concentrates placed two in the top ten with one up +65.8% and one down -20.5%, pointing to assortment volatility by form factor rather than a single-product issue. The pattern implies Lord Jones is tilting toward inhalables for near-term velocity while Edibles act as a stable anchor at the top with selective cannabinoid blends under pressure.
Top Selling Cannabis Brands
Data for this report comes from real-time sales reporting by participating cannabis retailers via their point-of-sale systems, which are linked up with Headset’s business intelligence software. Headset’s data is very reliable, as it comes digitally direct from our partner retailers. However, the potential does exist for misreporting in the instance of duplicates, incorrectly classified products, inaccurate entry of products into point-of-sale systems, or even simple human error at the point of purchase. Thus, there is a slight margin of error to consider. Brands listed on this page are ranked in the top twenty within the market and product category by total retail sales volume.

