Jun-2026
Sales
Trend
6-Month
Product Count
SKUs
Avg Price
YoY Sales Change
YoY Price Change
Market Insights Snapshot
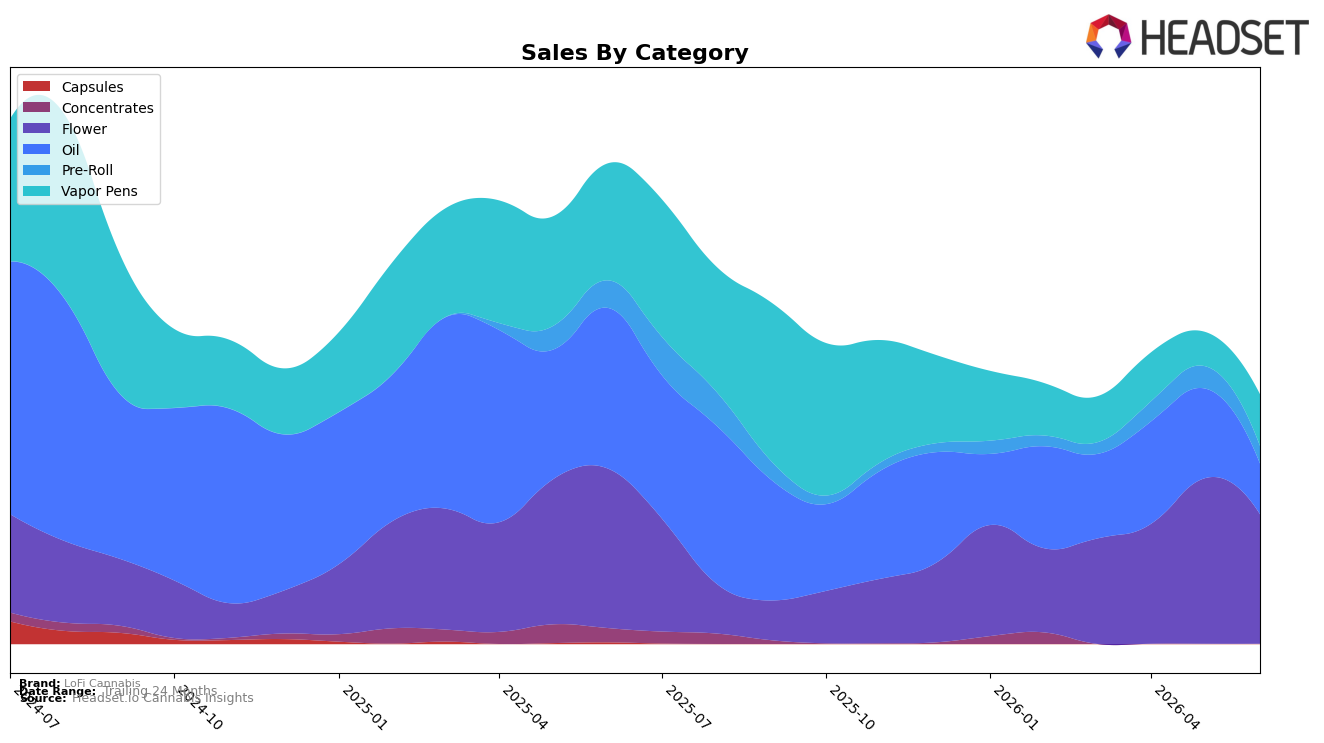
LoFi Cannabis concentrated over half of June 2026 sales in Flower at 51.97% share, even as Flower declined 18.80% year over year and 21.81% month over month, while Pre-Roll at 6.99% share fell 36.49% year over year and 21.32% month over month. Vapor Pens held 20.72% share with a 55.96% year-over-year contraction but a 50.90% month-over-month rebound, and Oil at 20.32% share contracted 68.52% year over year and 43.61% month over month. With the overall brand down 48.17% year over year and average price down 11.56%, the mix points to a pivot away from Oil and toward Vapor Pens recovery, implying LoFi Cannabis is relying on short-cycle MoM gains in inhalables to buffer persistent YoY declines across inhalable formats.
Because Vapor Pens carry a higher average price at $35.75 versus Flower at $24.46 and Oil at $26.03, the 50.90% month-over-month lift in Vapor Pens alongside a 21.81% month-over-month drop in Flower suggests a margin-seeking tilt, even as Vapor Pens’ 55.96% year-over-year decline and Oil’s 68.52% year-over-year slide cap volume scale. The category spread—51.97% Flower share against a combined 41.04% in concentrate-adjacent formats (Vapor Pens plus Oil)—and a Vapor Pens rank of 64 in British Columbia indicate LoFi Cannabis is trading near the long tail in premium-priced inhalables while leaning on Flower for base throughput, implying the brand’s positioning is skewing toward opportunistic, price-led wins in pens rather than durable share leadership in any single category.
Competitive Landscape
LoFi Cannabis sits at rank #64 in BC Vapor Pens in June 2026, down 8 positions year over year from #56 and up 12 positions versus March 2026’s #76, indicating recent quarter-on-quarter recovery despite a longer-term slide from its peak of #33 in August 2024; in contrast, BoxHot holds #1 while posting a -7.1% sales YoY change and Spinach climbed from #4 to #2 on 129.9% YoY sales growth, suggesting the competitive ceiling is tightening at the top even as mid-tier ranks remain fluid; the mix of a 12-rank rebound over three months alongside an 8-rank YoY decline implies LoFi Cannabis is stabilizing tactically but has yet to re-establish a sustained path back toward its August 2024 peak.

Notable Products
CBD:THC 1:1 Nostalgia x Rainbow Driver Cured Resin Cartridge (1g) posted the largest movement in June 2026 with +144.2% month over month and climbed to rank 7, while CBN Slumbr Oil (30ml) plunged -91.3% month over month to rank 10. At the top, Nostalgia (7g) fell -30.8% month over month yet held rank 1, and CBD Super Strength Oil (30ml) dropped -42.0% month over month to rank 3, indicating oil reliance is weakening as vapor pens gain momentum. Vapor Pens placed three SKUs in the top 10 including a +46.3% month over month move for Nostalgia 2.0 Cured Resin Cartridge (1g) at rank 4, whereas Flower held ranks 1-2 but both entries declined by -30.8% and -8.7%. The pattern implies a pivot toward inhalable formats and ratio-driven innovation, with legacy Flower anchoring share but ceding growth to Vapor Pens that can be scaled beyond a single flagship SKU.
Top Selling Cannabis Brands
Data for this report comes from real-time sales reporting by participating cannabis retailers via their point-of-sale systems, which are linked up with Headset’s business intelligence software. Headset’s data is very reliable, as it comes digitally direct from our partner retailers. However, the potential does exist for misreporting in the instance of duplicates, incorrectly classified products, inaccurate entry of products into point-of-sale systems, or even simple human error at the point of purchase. Thus, there is a slight margin of error to consider. Brands listed on this page are ranked in the top twenty within the market and product category by total retail sales volume.

