.svg)


Where to Buy
Armada Cannabis Co. is stocked at 281 licensed dispensaries across Michigan and Maine, 280 of them in Michigan, with the deepest coverage in New Buffalo, Grand Rapids, Detroit, Kalamazoo, and Monroe. Search by ZIP code or city below to find the closest one, or filter by product type if you are after a specific format.
Market Insights Snapshot
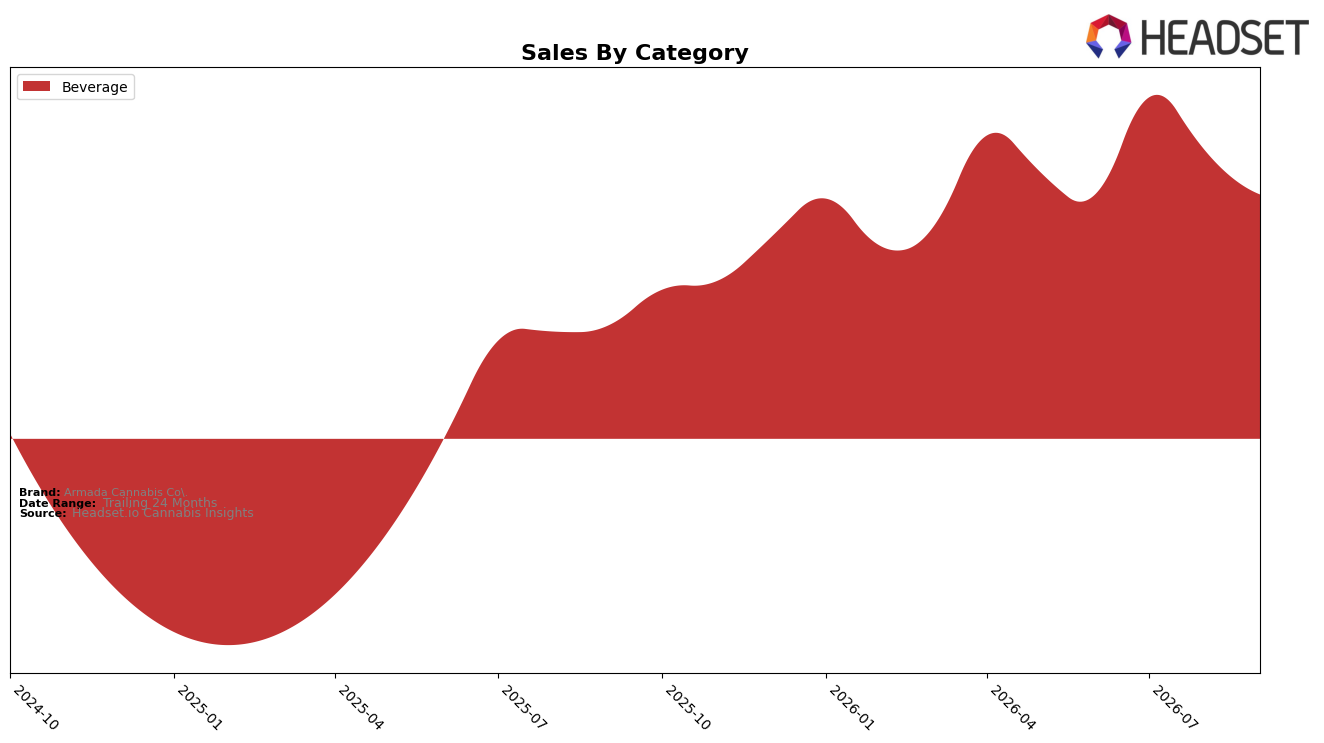
Armada Cannabis Co. operated as a single-category brand in September 2026, with Beverage accounting for 100.0% of sales and a rank of 9 within Beverage in Michigan; within that category, year-over-year sales grew 83.9% while month-over-month sales fell 13.4%. Pricing moved up 36.7% year over year to an average of $7.42, coinciding with the category’s full share concentration and a stable category focus. The pattern implies that Armada Cannabis Co. is consolidating around Beverage with elevated price realization despite a recent monthly pullback, positioning the brand as a focused Beverage participant in Michigan holding a top-10 rank.
The combination of 100.0% category concentration and a September 2026 rank of 9 indicates a reliance on Beverage scale rather than portfolio diversification, while the 83.9% year-over-year growth alongside a 13.4% month-over-month decline suggests demand seasonality or cadence sensitivity within Beverage. With average price up 36.7% year over year against a concurrent monthly volume softening, the mix shift is effectively price-led, which implies Armada Cannabis Co.’s positioning leans toward defending share through price and distribution in Beverage rather than expanding into adjacent categories in Michigan.
Competitive Landscape
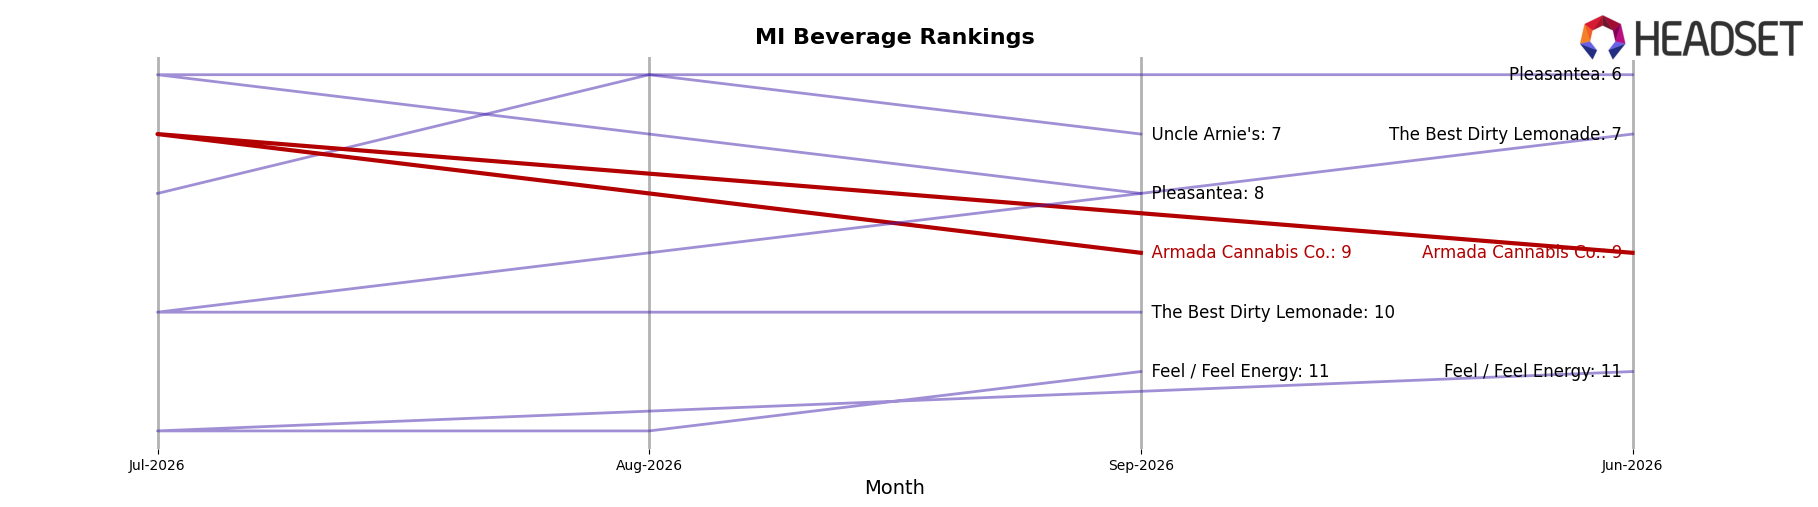
Armada Cannabis Co. sits at rank #9 in MI Beverage for September 2026, up 1 position YoY from #10, but flat versus June 2026 at #9; this stability contrasts with CQ (Cannabis Quencher) rising from #6 to #3 YoY while expanding sales by 74.08%, and Highly Casual improving from #8 to #4 alongside a 64.25% YoY sales increase. The brand’s peak was #6 in April 2026 before settling back to #9, while Chill Medicated advanced from #9 to #5 with 108.45% YoY growth and Mary Jones held #1 despite an -8.48% YoY decline, indicating that Armada Cannabis Co.’s minimal rank lift and lack of mid-year follow-through imply share is being redistributed toward faster-advancing rivals and that maintaining a top-10 position may rely on defending against high-velocity movers rather than overtaking the leaders.
Notable Products
Sparkling Sweet Apple Seltzer (20mg) posted the steepest decline at -45.0% MoM and fell to rank 4, while Sparkling Sweet Apple Soda (20mg THC, 12oz, 355ml) dropped -43.4% MoM at rank 3. In contrast, Triple Jam Soda (50mg THC, 12oz, 355ml) held rank 1 despite a -14.7% MoM slide, and Apple Cider Soda (20mg THC, 16oz, 473ml) stayed at rank 2 with a milder -2.4% MoM change and $33,358 in September 2026 sales. With all top-four SKUs in Beverages and two sparkling apple variants both contracting by more than -40%, the mix implies Armada Cannabis Co. is consolidating volume into fewer, higher-dose or seasonal leaders rather than broad variety within sparkling formats.
Top Selling Cannabis Brands






Data for this report comes from real-time sales reporting by participating cannabis retailers via their point-of-sale systems, which are linked up with Headset’s business intelligence software. Headset’s data is very reliable, as it comes digitally direct from our partner retailers. However, the potential does exist for misreporting in the instance of duplicates, incorrectly classified products, inaccurate entry of products into point-of-sale systems, or even simple human error at the point of purchase. Thus, there is a slight margin of error to consider. Brands listed on this page are ranked in the top twenty within the market and product category by total retail sales volume.

