Jun-2026
Sales
Trend
6-Month
Product Count
SKUs
Avg Price
YoY Sales Change
YoY Price Change
Market Insights Snapshot
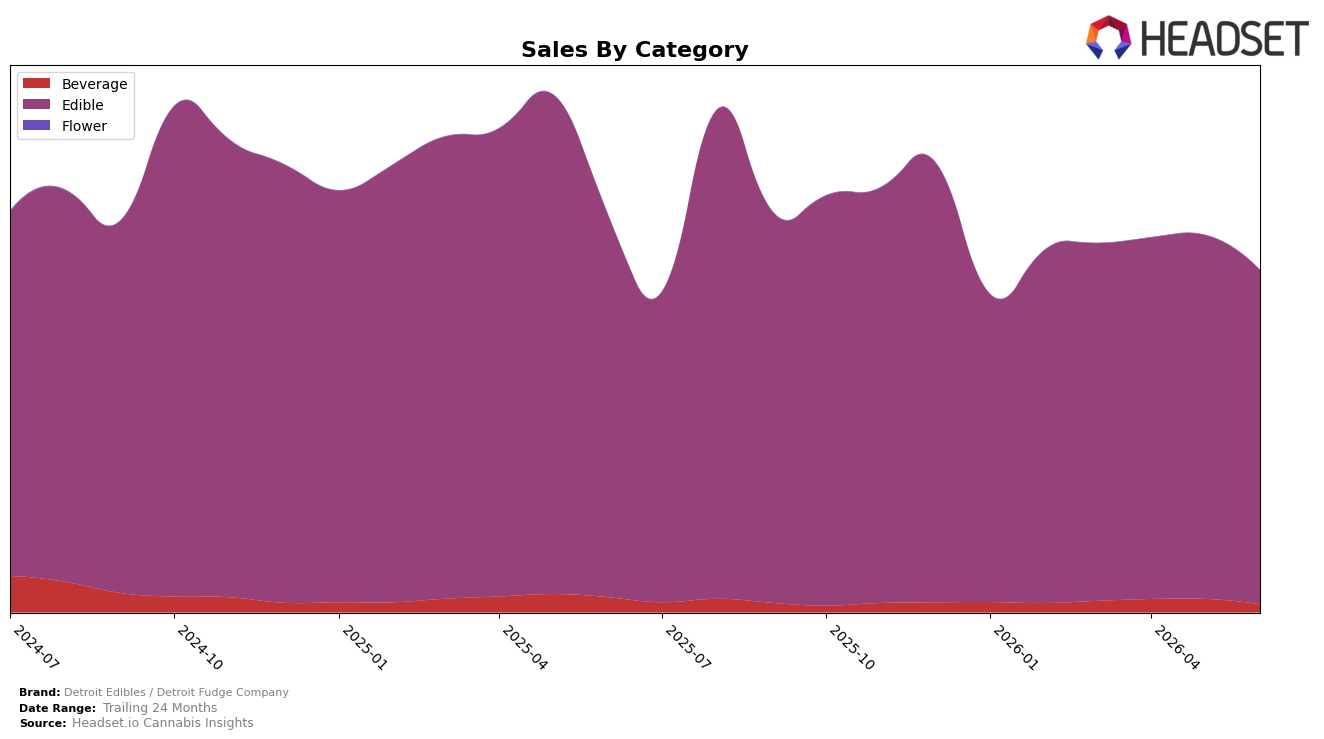
Detroit Edibles / Detroit Fudge Company concentrated 97.70% of June 2026 sales in Edible, with Beverage at 2.30%, and the Edible segment fell 12.56% year over year while dropping 8.15% month over month. Beverage contracted faster, down 47.06% year over year and 40.56% month over month, as overall brand sales declined 13.86% year over year despite a 23.45% increase in average price to $12.98. This pattern implies the brand leaned further into a single-category footprint while pricing up, trading volume for price in Edible and letting Beverage recede to a marginal role.
Within Michigan Edibles, the brand sat at rank 10 in June 2026 while Edible mix share reached 97.70% and Beverage contracted to 2.30%. The simultaneous 8.15% month-over-month decline in Edible and 40.56% drop in Beverage point to reduced cross-category reach, and the 23.45% average price lift alongside a 12.56% Edible year-over-year decline suggests a price-led strategy that prioritizes margin per unit over breadth. The implication is positioning centered on core Edibles at mid-teens price premiums with limited category diversification, which may cap upside at rank 10 unless pricing or mix rebalances toward volume recovery.
Competitive Landscape
Detroit Edibles / Detroit Fudge Company is ranked #10 in MI Edible in June 2026, a 1-position improvement from #11 year over year and flat versus March 2026 at #11, while still trailing its peak of #7 from February 2025; meanwhile, Wyld held #1 year over year and in June 2026 despite a -13.4% YoY sales change, and Good Tide slipped from #4 to #5 alongside a -16.2% YoY sales change, suggesting Detroit Edibles / Detroit Fudge Company’s incremental rank gain is more about relative stability amid top-tier softness than an absolute share grab.

Notable Products
Barracuda Dark Chocolate Bar 20-Pack (200mg) posted the steepest move in June 2026 with a -41.8% month-over-month drop and fell to rank 10, while Goodnight Peanut Butter Milk High Dose Barracuda Chocolate Bar 20-Pack (200mg) declined -9.4% at rank 2, implying a tilt away from darker and sleep-oriented variants toward other flavor profiles. Barracuda Crispy Milk Chocolate Bar 20-Pack (200mg) held rank 1 with +5.6% MoM, and Fruity Crispy Rice Treat (200mg) surged +45.2% at rank 4, together indicating momentum in sweeter, cereal-style formats over traditional dark bars. Across the top ten, 8 of 10 SKUs are Barracuda chocolate formats, yet two cup SKUs fell between -9.9% and -11.1% while the High Dose Mint Dark Chocolate Bar 20-Pack (200mg) rose +23.6% at rank 8, suggesting consumers are concentrating spend on a few lead bars rather than breadth across forms. The pattern implies Detroit Edibles / Detroit Fudge Company is consolidating share in milk-forward hero bars while dark and cup extensions face pruning risk, pointing resource allocation toward high-velocity flavors and away from underperforming variants.
Top Selling Cannabis Brands
Data for this report comes from real-time sales reporting by participating cannabis retailers via their point-of-sale systems, which are linked up with Headset’s business intelligence software. Headset’s data is very reliable, as it comes digitally direct from our partner retailers. However, the potential does exist for misreporting in the instance of duplicates, incorrectly classified products, inaccurate entry of products into point-of-sale systems, or even simple human error at the point of purchase. Thus, there is a slight margin of error to consider. Brands listed on this page are ranked in the top twenty within the market and product category by total retail sales volume.

