Jun-2026
Sales
Trend
6-Month
Product Count
SKUs
Avg Price
YoY Sales Change
YoY Price Change
Market Insights Snapshot
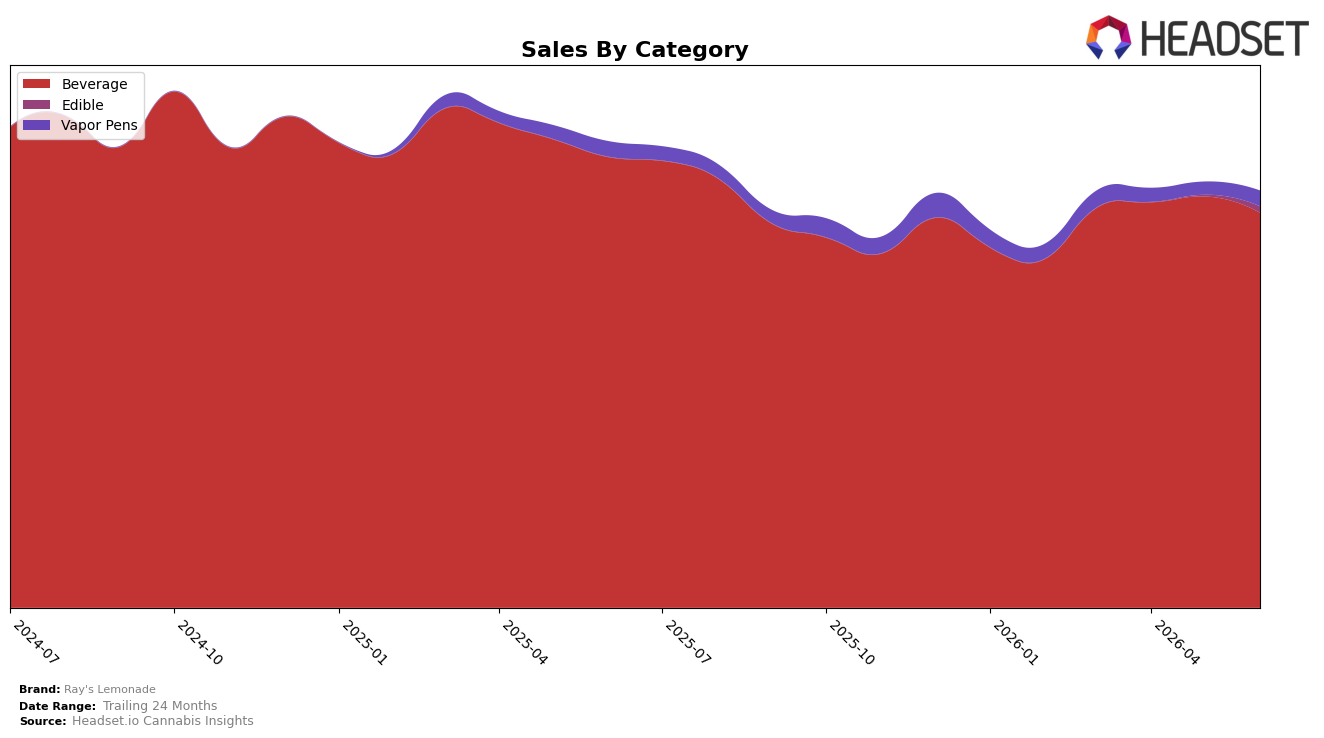
In June 2026, Beverage held 94.88% share with year-over-year sales down 12.35% and month-over-month down 3.94%, while Vapor Pens at 3.69% share posted a 1.70% YoY increase and a 20.07% MoM rise; Edible, though only 1.43% share, surged 384.85% MoM with no YoY baseline. Average price rose 6.43% YoY to $8.66 even as total brand sales declined 10.61% YoY, and within Beverage the average price sat at 8.45 while Vapor Pens carried 16.99, indicating mix pressure concentrated in the core. The pattern implies Ray's Lemonade is relying on a shrinking Beverage base while nascent recovery in Vapor Pens and a sharp MoM trial in Edible begin to offset declines at the margin.
Ray's Lemonade ranked 2 in Beverage in Washington, yet a 12.35% YoY Beverage drop alongside a 20.07% MoM lift in Vapor Pens signals competitive room to trade consumers into higher-priced formats without abandoning the Beverage position. With Beverage share still 94.88% and brand sales down 10.61% YoY, the 384.85% MoM spike in Edible and the 1.70% YoY gain in Vapor Pens suggest a pivot toward multi-format breadth that can stabilize share while preserving the rank in core Beverage; the implication is to lean into cross-format attachment and pricing tiers to convert category traffic into higher-margin units.
Competitive Landscape
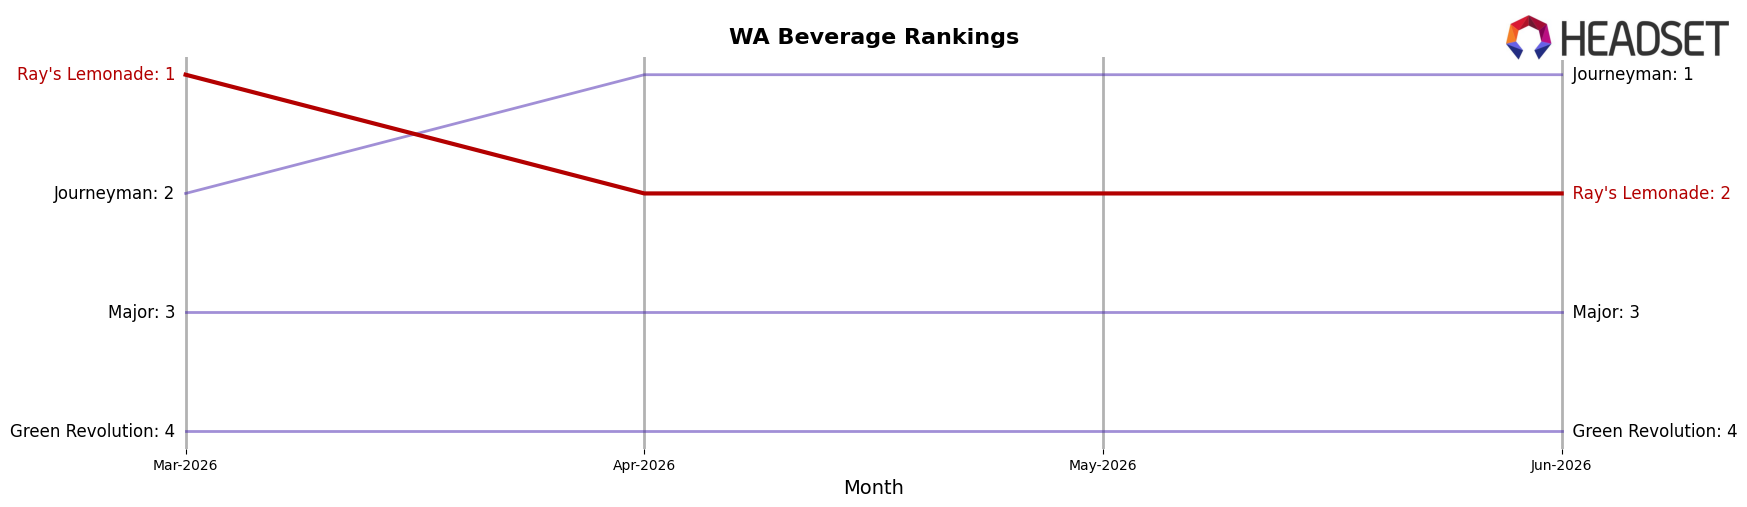
Ray's Lemonade sits at #2 in WA Beverage in June 2026 after a YoY slide of 1 rank from #1, despite having peaked at #1 in March 2026 and holding #1 three months ago; meanwhile, Journeyman rose to #1 from #2 with a 1.94% YoY sales gain, and Major held at #3 with a 21.02% YoY sales decline that widened the gap below the top two. The upward move of Blaze Soda from #8 to #5 on 65.67% YoY growth contrasts with Ray's Lemonade’s slip from #1 to #2, indicating that pressure is concentrated above and below as momentum shifts toward a challenger at the top and a fast riser from mid-pack; this rank trajectory implies Ray's Lemonade must arrest recent share leakage to avoid further displacement from #2 as upward pressure intensifies.
Notable Products
Lil Ray's - Huckleberry Lemonade Drink (100mg THC, 1.75oz) posted the steepest decline at -13.2% and sat at rank 8, while Strawberry Lemonade (10mg THC, 355ml) slipped -7.5% but still held rank 1. CBG/THC 1:1 Blackberry Lemonade (10mg CBG, 10mg THC, 355ml) eked out +0.2% at rank 2, and CBD/THC 2:1 Mango Lemonade (20mg CBD, 10mg THC, 355ml) rose +7.6% at rank 5, indicating that higher-CBD or blended cannabinoid SKUs are stabilizing the leaderboard as single-cannabinoid flagship SKUs soften. With eight of the top ten being small-format Lil Ray’s or flavor variants within the Beverage category, the mix skews toward multiple size and flavor extensions rather than new categories, which implies a shift toward portfolio breadth to defend share as the core top-two rely on modest month-over-month gains and rank resilience. The pattern suggests Ray's Lemonade is leaning into cannabinoid diversity and format variety to offset volume pressure on the leading SKUs, pointing to a commercial direction favoring breadth over depth in July 2026.
Top Selling Cannabis Brands
Data for this report comes from real-time sales reporting by participating cannabis retailers via their point-of-sale systems, which are linked up with Headset’s business intelligence software. Headset’s data is very reliable, as it comes digitally direct from our partner retailers. However, the potential does exist for misreporting in the instance of duplicates, incorrectly classified products, inaccurate entry of products into point-of-sale systems, or even simple human error at the point of purchase. Thus, there is a slight margin of error to consider. Brands listed on this page are ranked in the top twenty within the market and product category by total retail sales volume.

