Market Insights Snapshot
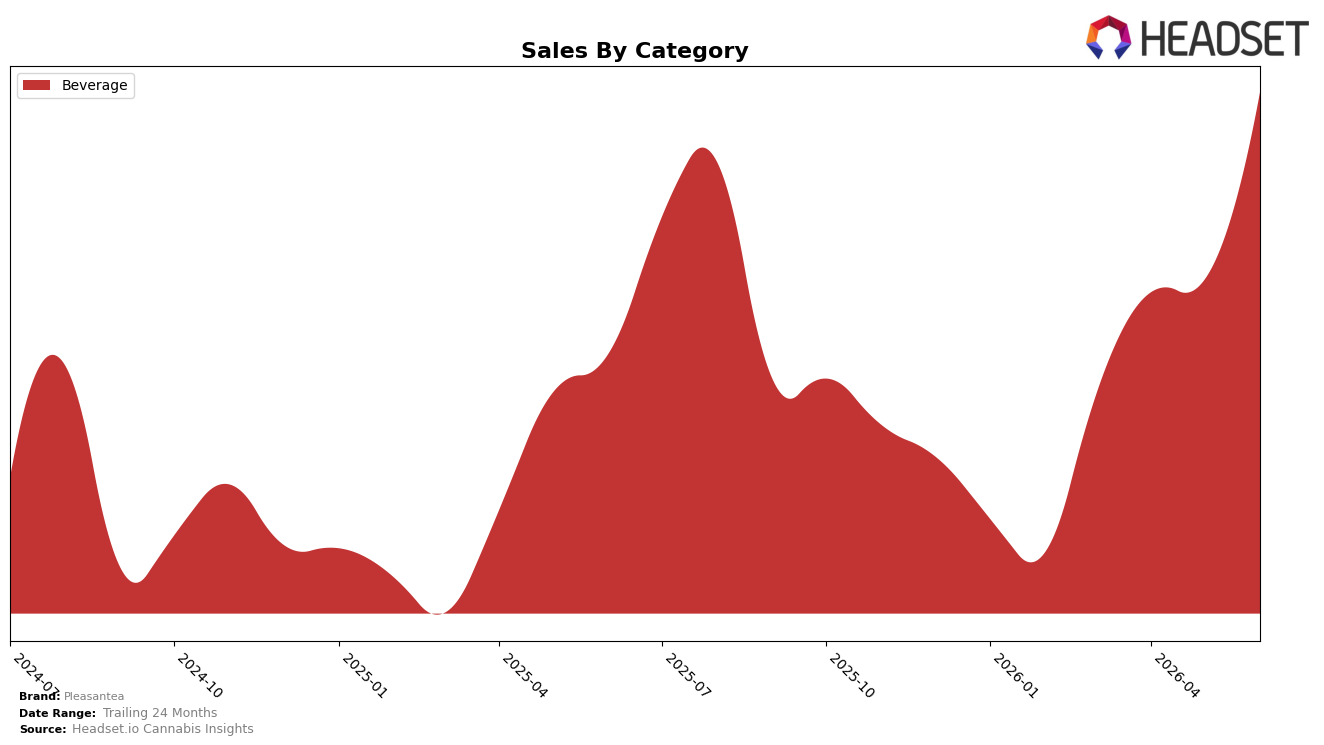
Pleasantea operated as a single-category brand in Beverage during June 2026, with category share at 100.0% and rank 5 in Michigan, pairing a 34.9% year-over-year sales lift with 22.7% month-over-month growth. Average price rose 26.5% YoY to $5.31 while sales expanded, indicating mix stability rather than trade-down, and the 24-month sales increase of 97.8% alongside a steady category focus implies scale is coming from depth in Beverage rather than breadth into adjacent segments.
The concentration in Beverage at 100.0% share and a top-5 position in Michigan suggests Pleasantea is competing on premiumization—up 26.5% in average price YoY—without sacrificing velocity, as evidenced by 22.7% MoM sales growth. The combination of a 34.9% YoY sales gain and a 97.8% 24-month increase implies pricing power and repeat uptake within a single category, meaning the brand’s near-term upside is more sensitive to maintaining rank 5 or improving it than to diversifying outside Beverage.
Competitive Landscape
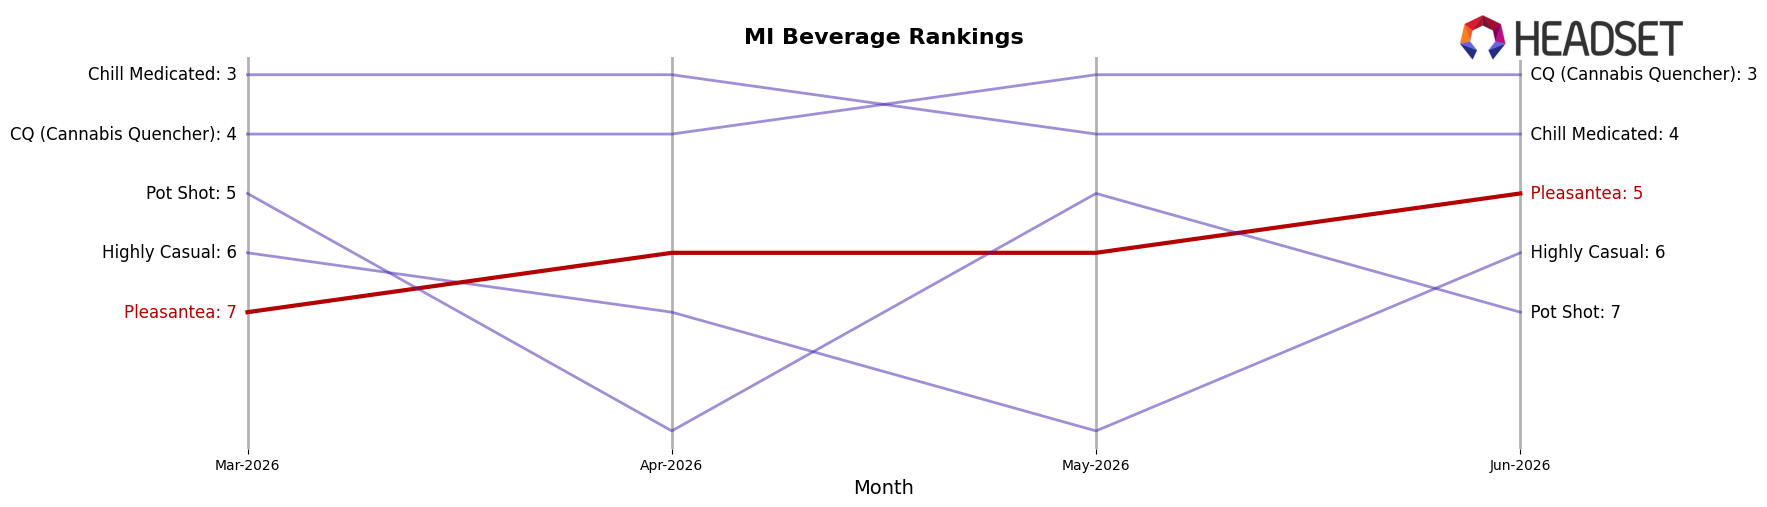
Pleasantea sits at #5 in MI Beverage in June 2026, improving 1 rank position year over year from #6 and gaining 2 spots versus March 2026 when it was #7, while competitors reshuffled with Mary Jones climbing from #2 to #1 and growing sales 22.2%, and Keef Cola sliding from #1 to #2 with a -10.5% sales change. Further pressure comes from CQ (Cannabis Quencher) jumping from #7 to #3 on 138.0% growth and Chill Medicated moving from #8 to #4 with 177.3% growth, indicating that Pleasantea’s new peak rank at #5 is driven more by incremental gains amid faster-rising rivals than by category-wide lift.
Notable Products
Lemon Iced Tea (10mg THC, 16oz) posted the largest month-over-month gain at +651.0% and reached rank 7, while Dragonfruit Lime (10mg THC, 12oz, 355ml) declined -18.4% at rank 8. Raspberry Iced Tea (10mg THC, 16oz, 473ml) rose +86.7% to rank 4 as Peach Iced Tea (10mg, 16oz, 473ml) jumped +96.4% to rank 5, indicating that two 10mg SKUs moved into the top five against 30mg leaders at ranks 1 and 2. With six of the top ten as Beverage iced teas across Raspberry, Peach, and Lemon flavors, the mix concentrates around iced tea formats, and June 2026 results imply Pleasantea is tilting toward lower-dose line extensions to expand reach while the 30mg flagships sustain premium positions; the single outlier is a flavor innovation that contracted, suggesting focus should remain on iced tea cores rather than niche variants.
Top Selling Cannabis Brands
Data for this report comes from real-time sales reporting by participating cannabis retailers via their point-of-sale systems, which are linked up with Headset’s business intelligence software. Headset’s data is very reliable, as it comes digitally direct from our partner retailers. However, the potential does exist for misreporting in the instance of duplicates, incorrectly classified products, inaccurate entry of products into point-of-sale systems, or even simple human error at the point of purchase. Thus, there is a slight margin of error to consider. Brands listed on this page are ranked in the top twenty within the market and product category by total retail sales volume.

