.svg)

Sep-2026
Sales
Trend
6-Month
Product Count
SKUs
Avg Price
YoY Sales Change
YoY Price Change


Market Insights Snapshot
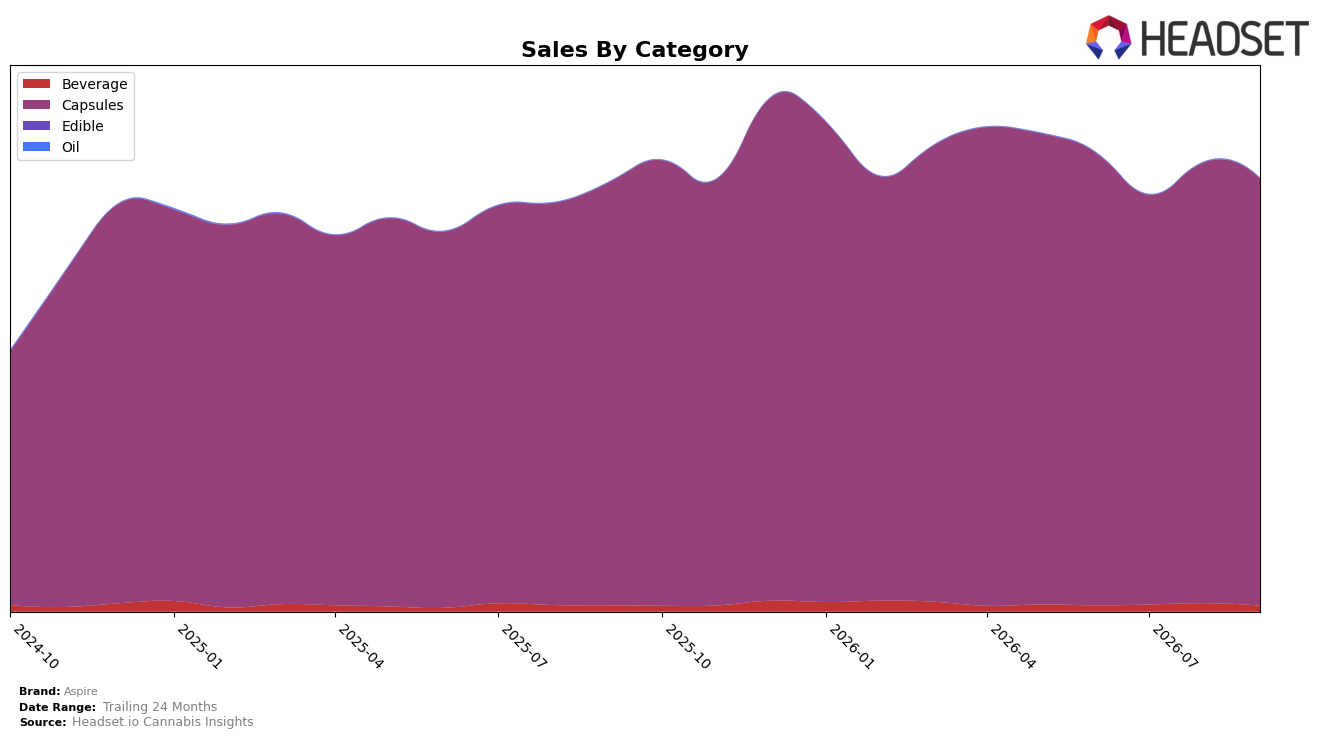
In September 2026, Aspire’s category mix was overwhelmingly concentrated in Capsules at 98.66% share with a year-over-year change of 4.20% and a month-over-month decline of 3.18%, while Beverage held 1.31% share with a year-over-year decline of 4.26% and a month-over-month decline of 29.89%. Edible registered 0.03% share without comparable year-over-year or month-over-month data, and the brand’s average price rose 8.21% year over year as overall brand sales inched up 1.00% year over year. With Capsules ranked 1 in Ontario and the brand’s 24‑month sales up 91.29%, the mix indicates dependence on a single category leader position paired with short-term softness in monthly Capsules velocity.
The concentration in Capsules at 98.66% share combined with a 3.18% month-over-month decline and a 4.26% month-over-year drop in Beverage implies Aspire’s positioning is anchored to a premium-priced pill format that can sustain annual growth despite monthly volatility. Holding rank 1 in Capsules in Ontario alongside an 8.21% year-over-year price increase and only a 1.00% year-over-year sales gain suggests pricing power but limited cross-category insulation, meaning near-term resilience depends on maintaining Capsule leadership while Beverage’s 29.89% month-over-month contraction constrains diversification.
Competitive Landscape
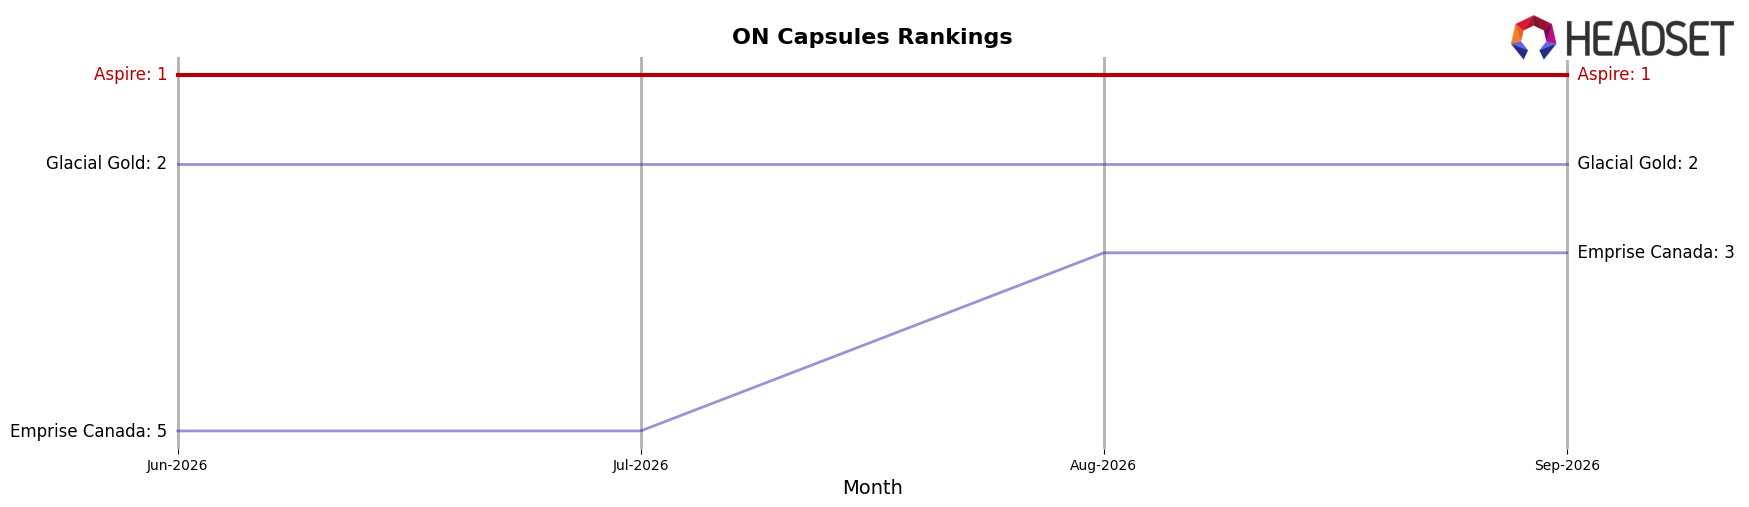
Aspire is currently ranked #1 in ON Capsules and held #1 in September 2025, with no YoY rank change and no 3-month movement from #1, while its peak rank of #1 occurs in September 2026; in contrast, Glacial Gold sits at #2 after improving from #4 year over year with a 38.3% sales increase, and Emprise Canada is #3 after rising from #5 alongside 43.3% YoY sales growth, whereas Tweed slid from #2 to #4 with a 26.3% sales decline and Redecan fell from #3 to #5 with a 26.1% drop; this stability at #1 against upward pressure from #2 and #3 implies Aspire’s position is defended by loyalty or distribution breadth, but accelerating gains from the chasing set raise the probability of tighter share spreads into September 2026.
Notable Products
Spark THC Moondrops (500mg THC, 16ml) posted the largest movement in September 2026 with a +118.7% MoM surge to $1,417 while climbing into rank 9, contrasting with SPARK THC Rocket Moonrocks Capsules 100-Pack (1000mg) at rank 4 sliding -12.5% MoM and CBD/THC 1:1 Spark Moonrocks Live Rosin Reserve Capsules 30-Pack (300mg CBD, 300mg THC) at rank 5 falling -25.6% MoM. Capsules occupy 7 of the top 10 ranks, including Spark THC Moonrocks Live Rosin Reserve Capsules 30-Pack (300mg) holding rank 1 at -3.7% MoM and Spark THC Moonrocks Capsules 50-Pack (500mg) at rank 3 up +14.2% MoM, indicating a portfolio centered on high-dose formats but with emerging trial in non-capsule niches. The split between a +118.7% Beverage rebound at rank 9 and a -38.4% MoM drop for Spark THC Moonshot (100mg THC, 90ml) at rank 7 signals volatility within beverages alongside steadier capsule leadership at ranks 1 and 3, implying Aspire is balancing core capsule retention with selective experimentation in faster-moving liquid SKUs.
Top Selling Cannabis Brands






Data for this report comes from real-time sales reporting by participating cannabis retailers via their point-of-sale systems, which are linked up with Headset’s business intelligence software. Headset’s data is very reliable, as it comes digitally direct from our partner retailers. However, the potential does exist for misreporting in the instance of duplicates, incorrectly classified products, inaccurate entry of products into point-of-sale systems, or even simple human error at the point of purchase. Thus, there is a slight margin of error to consider. Brands listed on this page are ranked in the top twenty within the market and product category by total retail sales volume.

