.svg)

Sep-2026
Sales
Trend
6-Month
Product Count
SKUs
Avg Price
YoY Sales Change
YoY Price Change


Market Insights Snapshot
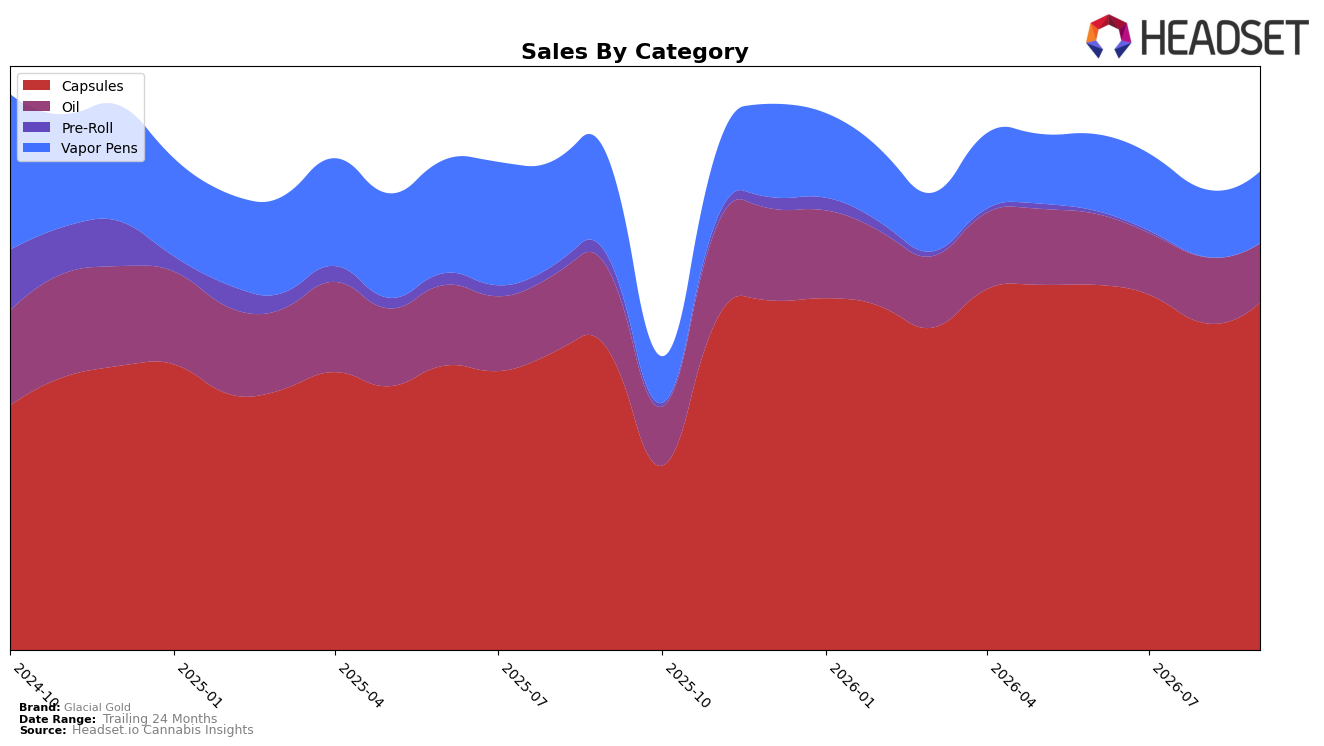
Glacial Gold concentrated 72.18% of September 2026 sales in Capsules with year-over-year growth of 15.78% and month-over-month growth of 6.18%, while Vapor Pens held 15.05% share with a -27.24% YoY decline but a 6.08% MoM uptick. Oil accounted for 12.50% share with -26.38% YoY and -9.96% MoM, and Pre-Roll dwindled to 0.27% share with -90.15% YoY and -9.21% MoM; despite total brand sales down 2.65% YoY, Capsules maintained a category rank of 1 in British Columbia. The mix shift toward Capsules, alongside a 3.50% YoY increase in average price to $37.33 and concurrent weakness in Oil and Pre-Roll, implies the brand is consolidating around its highest-velocity form factor and relying on Capsules to buffer broader declines.
The combination of a 6.18% MoM gain in Capsules share contribution and a 6.08% MoM lift in Vapor Pens, offset by a -9.96% MoM contraction in Oil and a -9.21% MoM dip in Pre-Roll, indicates a deliberate pivot toward ingestible and inhalable segments with greater price defensibility. Holding the number 1 rank in Capsules within British Columbia, while registering a -2.65% YoY decline in overall sales and a -8.45% change vs. 24 months, implies near-term positioning defined by leadership in Capsules and selective retreat from underperforming categories to protect share and pricing power.
Competitive Landscape
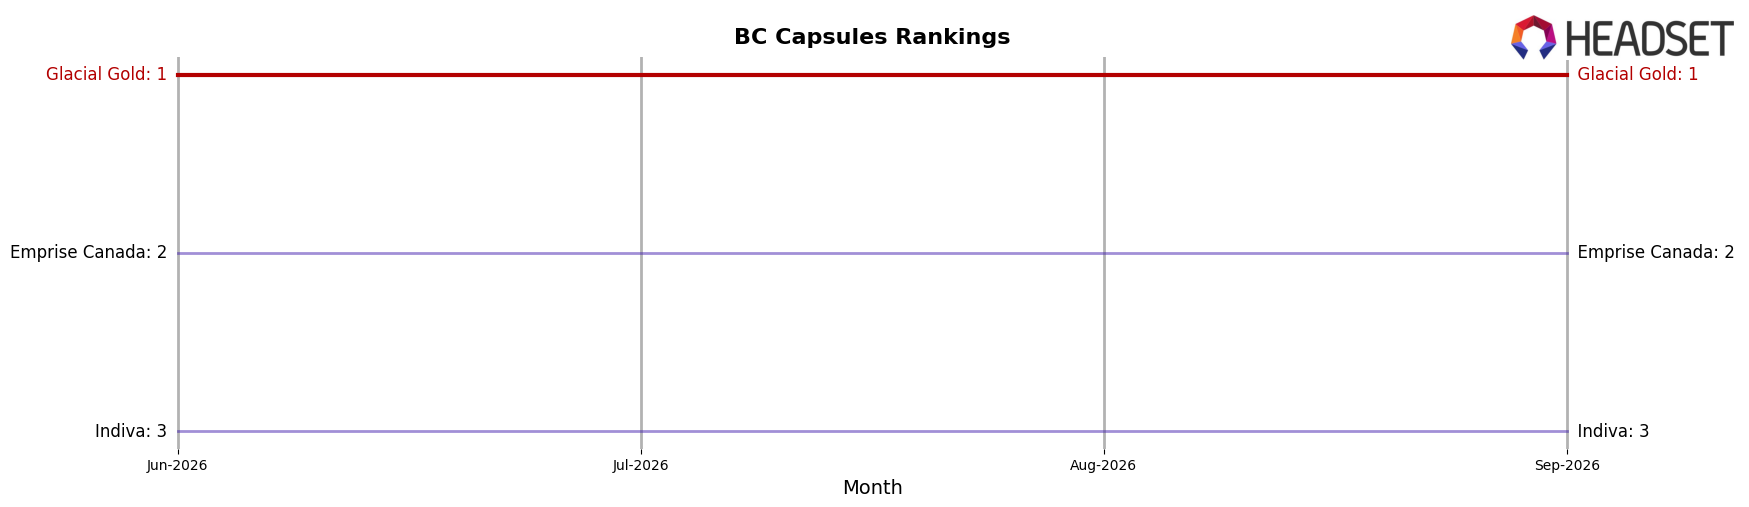
Glacial Gold sits at rank #1 in BC Capsules in September 2026 and is flat year over year at #1, while Emprise Canada holds #2 with a -23.8% YoY sales change and Indiva is #3 with a -53.7% YoY decline; further back, Nutra improved rank from #5 YoY to #4 despite a -1.0% sales shift, whereas Simply Bare slipped from #4 to #5 with a -29.2% YoY drop. The combination of Glacial Gold maintaining #1 across September 2026 and three-month rank stability at #1, alongside competitors either declining in sales or losing rank positions, implies Glacial Gold’s rank lead is being sustained more by competitor contraction than by category-wide expansion.
Notable Products
Max Thc 30 Drops (35ml) posted the steepest decline at -17.5% while falling to rank 9, whereas Anytime - CBD/THC 1:1 Honey Dewcumber Distillate Disposable (1g) jumped +25.5% to rank 7, indicating a tilt away from Oils toward inhalable trial. THC Softgels 100-Pack (1000mg) held rank 1 with +6.0% MoM and CBD/THC 1:1 Balanced Softgel 100-Pack (1000mg CBD, 1000mg THC) stayed at rank 2 with +15.8% MoM, and with six of the top ten in Capsules, the mix implies Glacial Gold is consolidating share in value-dose softgels while selectively expanding into Vapor Pens to diversify basket entry points.
Top Selling Cannabis Brands






Data for this report comes from real-time sales reporting by participating cannabis retailers via their point-of-sale systems, which are linked up with Headset’s business intelligence software. Headset’s data is very reliable, as it comes digitally direct from our partner retailers. However, the potential does exist for misreporting in the instance of duplicates, incorrectly classified products, inaccurate entry of products into point-of-sale systems, or even simple human error at the point of purchase. Thus, there is a slight margin of error to consider. Brands listed on this page are ranked in the top twenty within the market and product category by total retail sales volume.

