.svg)


Market Insights Snapshot
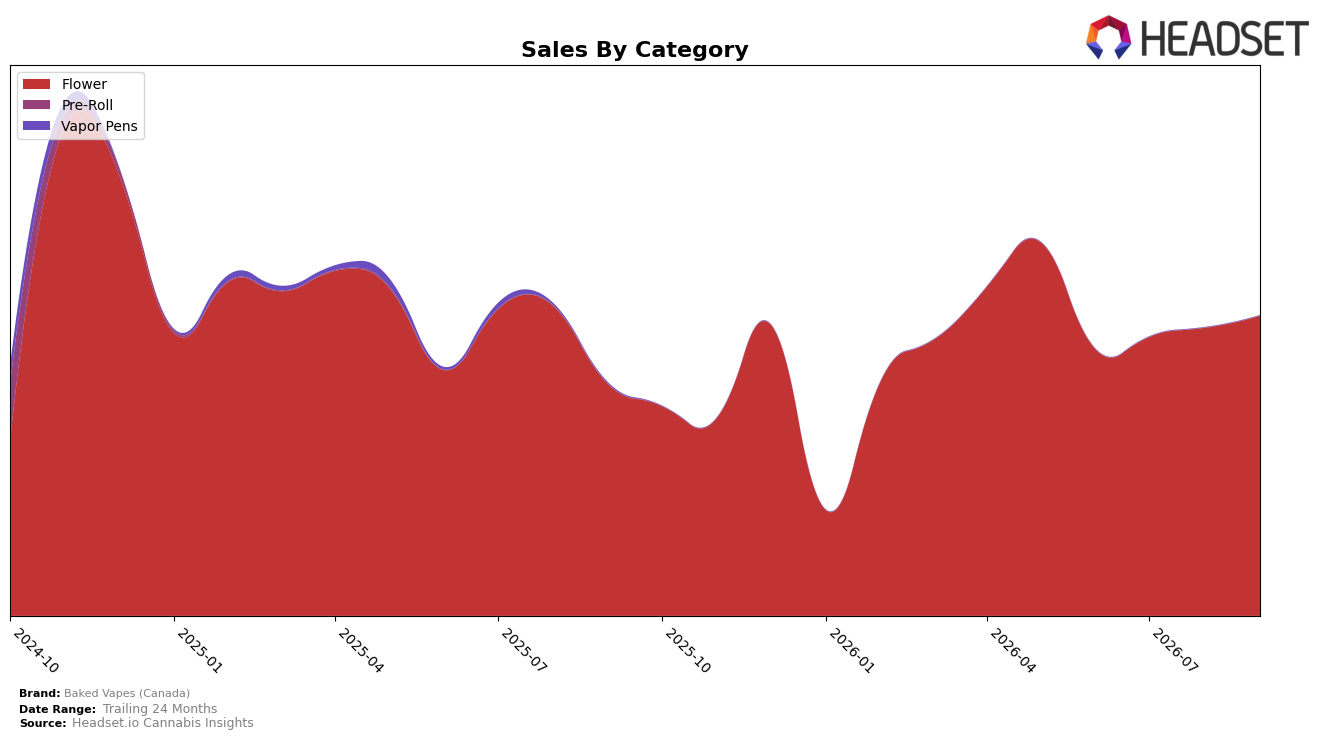
In September 2026, Baked Vapes (Canada) concentrated 100.0% of sales in Flower, with Flower sales up 29.57% year over year and 4.16% month over month, while the brand’s overall sales rose 29.04% YoY and its average price increased 0.24% YoY to $186.92. Within Alberta Flower, the brand held rank 24, indicating that a single-category focus coexisted with mid-tier placement; taken together, the 4.16% MoM lift alongside a 29.57% YoY surge implies momentum is coming from depth within Flower rather than mix diversification.
The one-category concentration coupled with rank 24 in Alberta suggests a positioning that trades breadth for specialization, where pricing stability (+0.24% YoY) supports volume-led gains (+29.57% YoY) without relying on discount-driven share grabs. The pattern—4.16% MoM growth on a fully Flower-weighted base and a 29.04% YoY brand-wide increase—implies the brand’s competitive path is to climb ranks by expanding Flower assortment or potency/format niches, as opposed to near-term multi-category entry that could dilute the current momentum.
Competitive Landscape
Baked Vapes (Canada) sits at rank #24 in AB Flower for September 2026, improving 8 positions year over year from #32 and edging 1 spot higher versus June 2026 when it was #25; however, the brand remains 10 positions below its peak of #14 set in November 2024, indicating recovery without a return to prior highs. In the same period, Back Forty / Back 40 Cannabis climbed from #2 to #1 while recording a -6.7% YoY sales change, and FIGR advanced from #11 to #4 with a 141.2% YoY sales increase, signaling that Baked Vapes (Canada)’s modest rank gains are occurring amid both share consolidation at the top and rapid movers in the upper tier; the trajectory implies a mid-pack stabilization path that will require outsized share wins to break back toward the top 15.

Notable Products
PSC (28g) posted a month-over-month increase of 4.2% and held rank 1 in September 2026, indicating incremental momentum at the very top while no other SKUs entered the top tier. With Flower accounting for 100% of the visible top-10 representation and PSC (28g) alone generating $232,808, the assortment is concentrated rather than diversified across categories. The absence of any SKU with a gain over 50% or a decline under -10% and the steady rank 1 position together point to a single-SKU anchor strategy rather than a portfolio of movers. This pattern implies Baked Vapes (Canada) is leaning into a flagship Flower format to drive stability, prioritizing depth in one hero product over breadth across multiple SKUs.
Top Selling Cannabis Brands






Data for this report comes from real-time sales reporting by participating cannabis retailers via their point-of-sale systems, which are linked up with Headset’s business intelligence software. Headset’s data is very reliable, as it comes digitally direct from our partner retailers. However, the potential does exist for misreporting in the instance of duplicates, incorrectly classified products, inaccurate entry of products into point-of-sale systems, or even simple human error at the point of purchase. Thus, there is a slight margin of error to consider. Brands listed on this page are ranked in the top twenty within the market and product category by total retail sales volume.

