Market Insights Snapshot
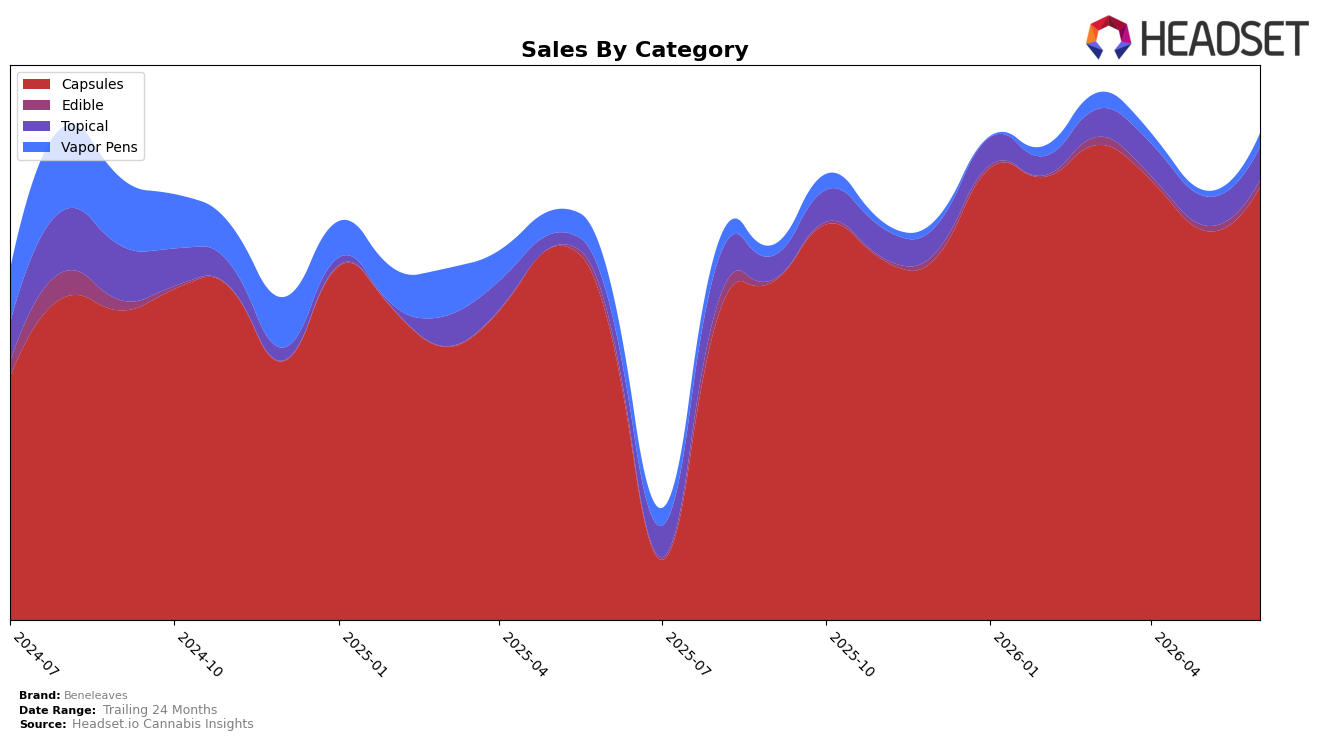
In June 2026, Capsules concentrated 89.19% share with year-over-year growth of 45.84% and month-over-month growth of 11.23%, while Topical reached 6.77% share on 104.19% YoY and 14.03% MoM gains. Vapor Pens held 2.74% share with a -46.86% YoY but a 146.48% MoM swing, and Edible sat at 1.30% share with -8.37% YoY and 29.33% MoM growth. Brand-wide sales were up 40.76% YoY, and the average price declined 7.27% to $27.47, with Ohio leadership anchored by a number 1 rank in Capsules; the pattern implies a category-led expansion where Capsules scale is masking volatility in smaller lines while price decreases broaden reach.
The mix suggests a defensive moat in Capsules (number 1 rank in Ohio) paired with exploratory upside: Vapor Pens’ 146.48% MoM rebound alongside a -46.86% YoY signals a testing phase rather than a turnaround, and Topical’s 104.19% YoY on just 6.77% share points to a niche acceleration that can diversify risk. With Edible up 29.33% MoM despite -8.37% YoY, and Capsules adding 11.23% MoM on top of 45.84% YoY, the implication is that June 2026 momentum is best leveraged by protecting Capsule price-pack architecture while selectively funding Topical and Edible trials to reduce reliance on a single category without over-committing to still-unstable Vapor Pens.
Competitive Landscape
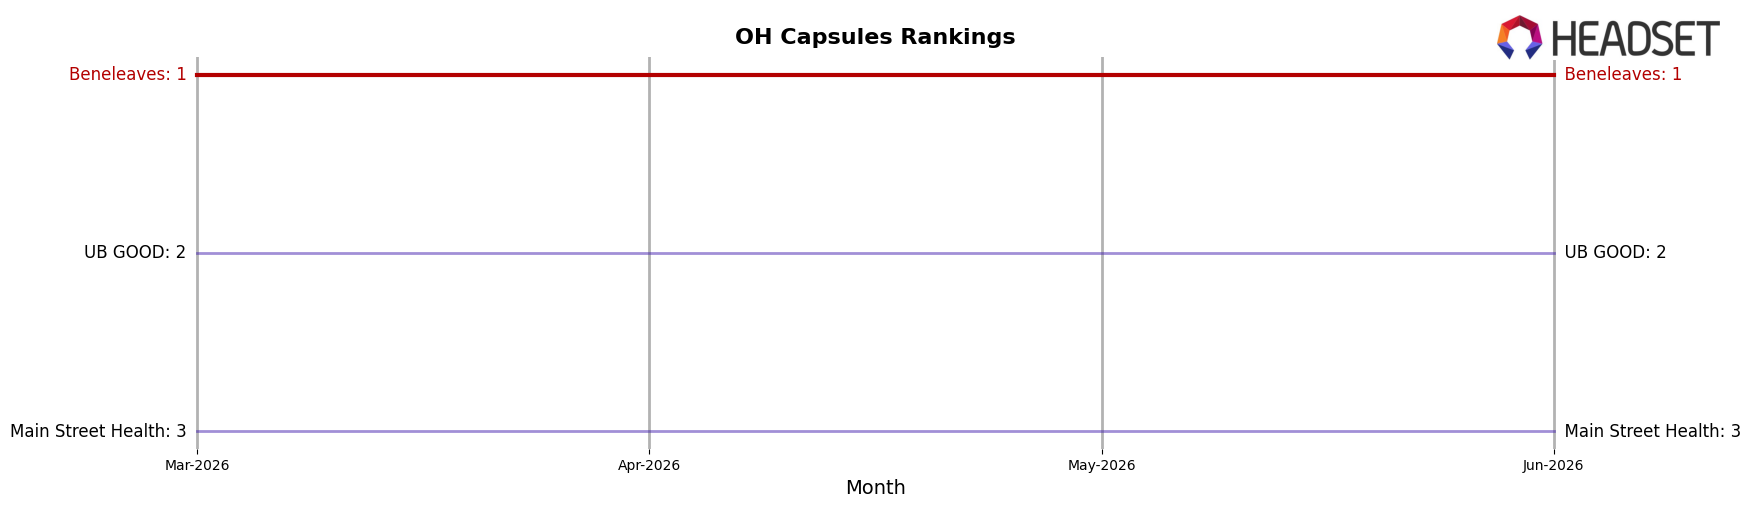
Beneleaves holds #1 in OH Capsules in June 2026, unchanged from #1 a year earlier, and steady at #1 over the past three months; that stability contrasts with UB GOOD moving from #4 to #2 alongside a 66.2% year-over-year sales increase, while Butterfly Effect - Grow Ohio slipped from #2 to #4 with a 46.5% year-over-year sales decline. Meanwhile, Main Street Health stayed at #3 with an 11.1% year-over-year sales rise, creating a laddered field where Beneleaves’ immobility at #1 versus upward pressure from #2 implies a defense-first posture is required to prevent a near-term share challenge despite peak rank coinciding with June 2026.
Notable Products
Hybrid Unflavored RSO Capsules 11-Pack (110mg) posted the steepest movement in June 2026 with a -26.7% month-over-month drop and fell into rank 9, while RSO Capsules 11-Pack (330mg) surged +61.0% and held at rank 6. RSO Capsules 22-Pack (660mg) remained at rank 1 with +13.6% MoM and generated $111,237, and THC/CBG 1:1 Sativa Helios Capsules 22-Pack (220mg THC, 220mg CBG) climbed on +27.7% MoM at rank 4. With eight of the top ten coming from Capsules and two RSO variants moving in opposite directions, the mix points to consolidation around higher-dose capsule formats and away from lighter RSO options.
Top Selling Cannabis Brands
Data for this report comes from real-time sales reporting by participating cannabis retailers via their point-of-sale systems, which are linked up with Headset’s business intelligence software. Headset’s data is very reliable, as it comes digitally direct from our partner retailers. However, the potential does exist for misreporting in the instance of duplicates, incorrectly classified products, inaccurate entry of products into point-of-sale systems, or even simple human error at the point of purchase. Thus, there is a slight margin of error to consider. Brands listed on this page are ranked in the top twenty within the market and product category by total retail sales volume.

