.svg)

Sep-2026
Sales
Trend
6-Month
Product Count
SKUs
Avg Price
YoY Sales Change
YoY Price Change


Where to Buy
Butterfly Effect - Grow Ohio is stocked at 101 licensed dispensaries across Ohio, with the deepest coverage in Columbus, Cincinnati, Dayton, Akron, and Cleveland. Search by ZIP code or city below to find the closest one, or filter by product type if you are after a specific format.
Market Insights Snapshot
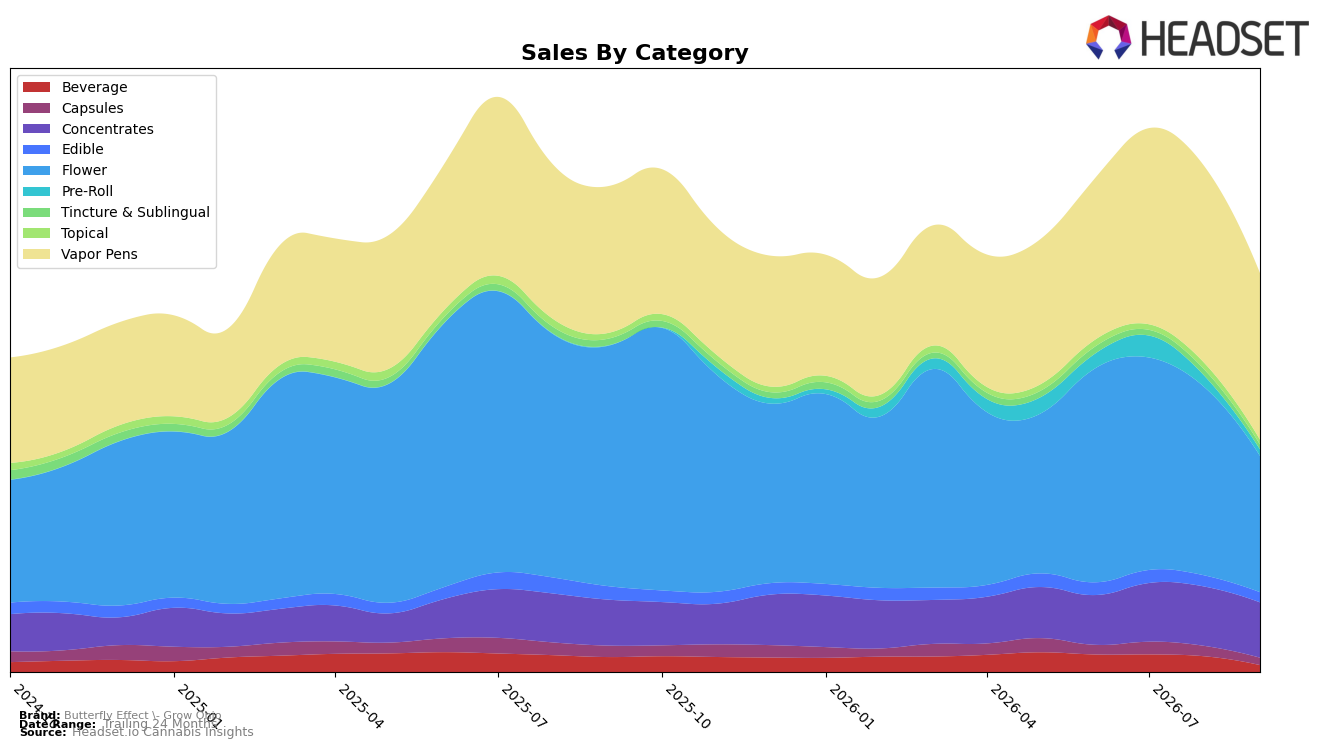
Vapor Pens expanded to 41.9% share with 13.5% year-over-year growth but contracted 15.3% month-over-month, while Flower slid to 34.3% share with a 43.4% year-over-year decline and a 27.6% month-over-month drop; this mix shift helped lift overall 24‑month sales by 49.2% even as September 2026 brand sales fell 18.0% year-over-year. Concentrates grew 20.4% year-over-year but dipped 6.8% month-over-month to 13.9% share, and Pre-Roll posted a 4,397.4% year-over-year surge but retreated 42.5% month-over-month to 1.6% share; combined with a 7.0% year-over-year decline in average price to $34.58, the pattern implies reliance on higher-turn inhalables for volume with price-led softening limiting month-over-month momentum.
With Vapor Pens ranked 5 in Ohio and holding a 41.9% internal mix, the brand’s positioning tilts toward a top-tier inhalables foothold even as month-over-month pullbacks of 15.3% in Vapor Pens and 27.6% in Flower compress near-term throughput. The dual signal of 20.4% year-over-year growth in Concentrates alongside a 54.4% year-over-year contraction in Beverage, plus month-over-month declines of 29.3% in Capsules and 24.1% in Tincture & Sublingual, implies concentration around core inhalables where rank strength can be defended, while deprioritized wellness and beverage formats contribute to volatility rather than incremental share.
Competitive Landscape
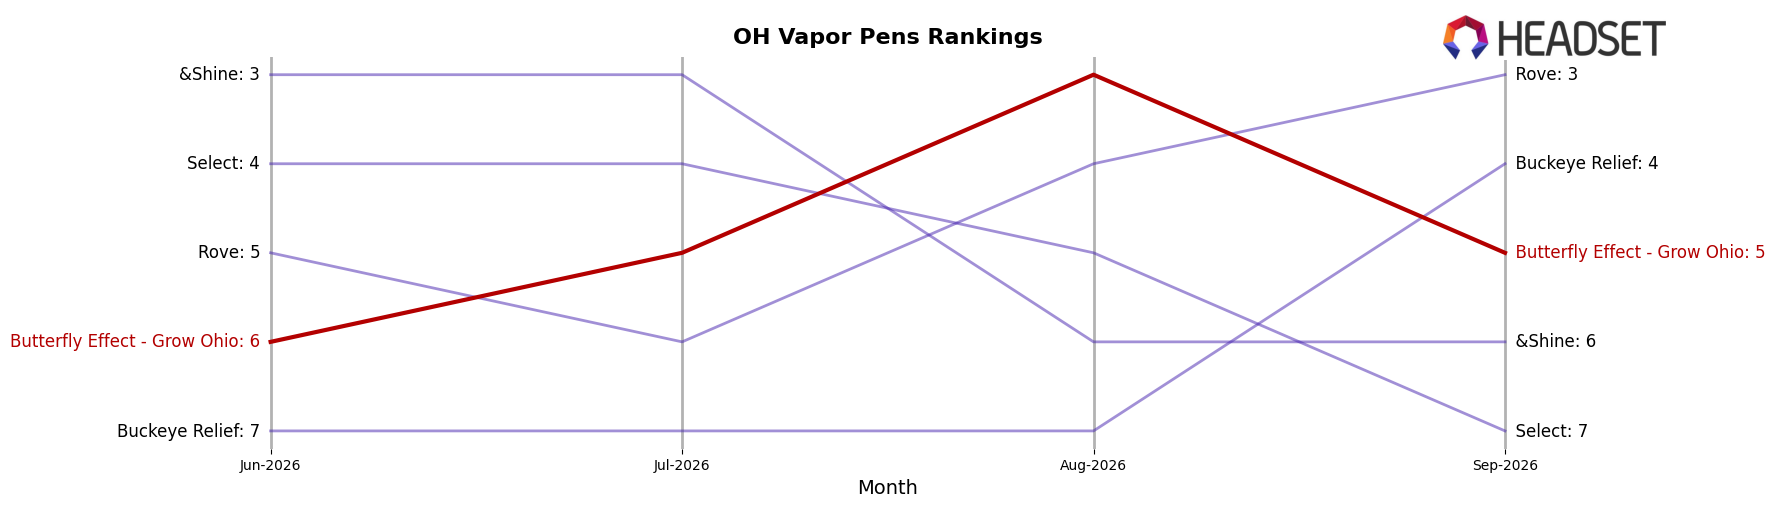
Butterfly Effect - Grow Ohio sits at rank #5 in OH Vapor Pens in September 2026, down 3 positions from its peak at #2 in September 2025 but up -1 position from rank #6 in June 2026, while its year-over-year rank slipped from #2 to #5. In the same window, Certified (Certified Cultivators) held #1 while posting 121.9% YoY sales growth, and Klutch Cannabis climbed from #7 to #2 with 155.3% YoY growth; meanwhile, Rove moved from #10 to #3 and Buckeye Relief advanced from #5 to #4 with 47.0% YoY growth. The pattern implies Butterfly Effect - Grow Ohio’s rank trajectory is stabilizing in the mid‑tier while faster YoY movers are compressing share at the top, signaling a need to counter competitors’ triple‑digit growth to avoid further rank erosion.
Notable Products
Lemon Dissolve Power Sip (50mg THC, 2oz, 59ml) posted the steepest decline at -30.6% while holding rank 10, and Black Jack (3.5g) slid -13.1% to rank 4, signaling pressure at the lower end of the top ten. Layer Cake (3.5g) in contrast inched up +3.7% to remain rank 1 with $115,879, while Layer Cake Live Resin iKrusher Uzo Disposable (1g) fell -25.8% at rank 8, indicating divergent trajectories between flagship flower and its paired vapor SKU. Four of the top ten are Flower SKUs clustered in ranks 1, 3, 4, and 5, but with Notorious (3.5g) down -29.8% at rank 5 and Lemon G (3.5g) static at rank 3, the category mix points to dependence on a single leader more than broad-based flower momentum. The pattern implies a tilt toward defending premium flower leadership while Vapor Pens and Beverages require SKU pruning or repositioning to stabilize share.
Top Selling Cannabis Brands






Data for this report comes from real-time sales reporting by participating cannabis retailers via their point-of-sale systems, which are linked up with Headset’s business intelligence software. Headset’s data is very reliable, as it comes digitally direct from our partner retailers. However, the potential does exist for misreporting in the instance of duplicates, incorrectly classified products, inaccurate entry of products into point-of-sale systems, or even simple human error at the point of purchase. Thus, there is a slight margin of error to consider. Brands listed on this page are ranked in the top twenty within the market and product category by total retail sales volume.

