.svg)
Jul-2026
Sales
Trend
6-Month
Product Count
SKUs
Avg Price
YoY Sales Change
YoY Price Change


Market Insights Snapshot
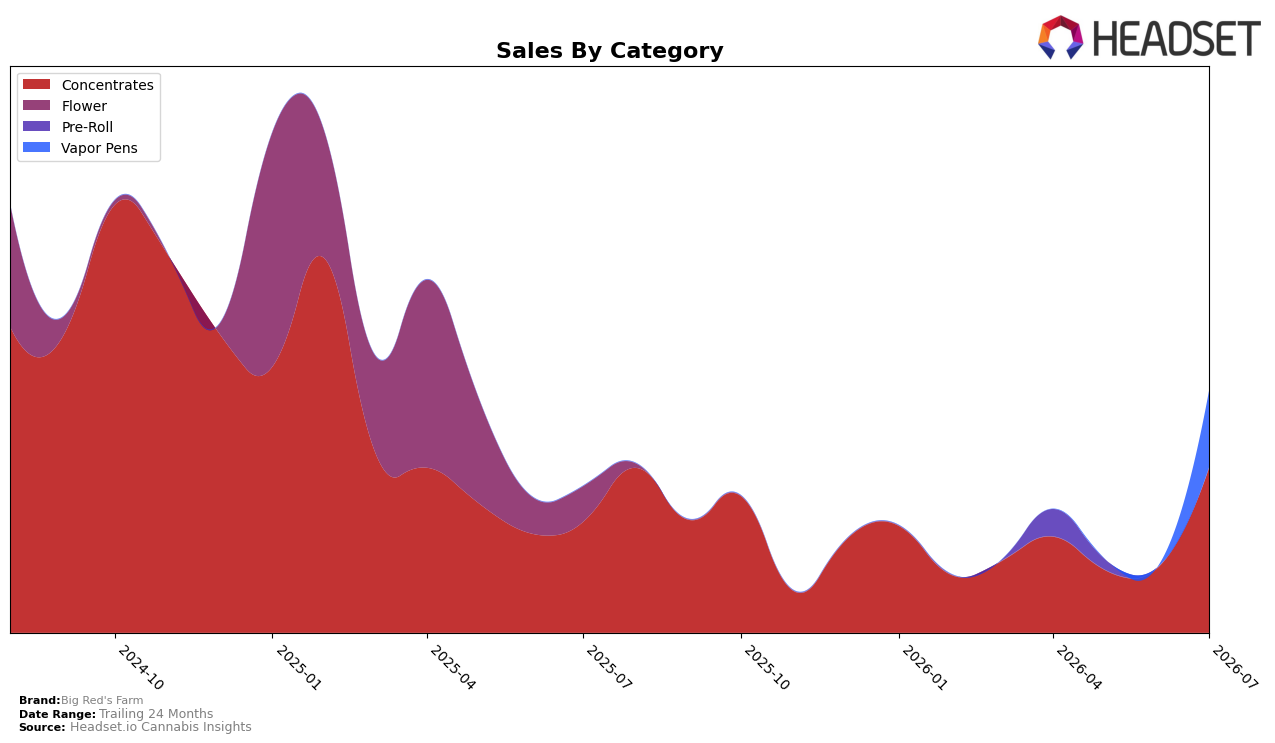
In July 2026, Big Red's Farm concentrated its mix into Concentrates at 68.31% share while Vapor Pens held 31.69% share, with Concentrates up 154.90% MoM and 48.96% YoY and the overall brand up 65.29% YoY. Average price rose 70.24% YoY to $21.02 while Concentrates averaged $18.04 and Vapor Pens $32.65, implying a price ladder that tilts revenue toward higher-ticket Vapor Pens despite lower share. The pattern implies a deliberate shift to volume growth via Concentrates for near-term velocity while preserving premium revenue density through Vapor Pens, setting up mix-led volatility if the 154.90% MoM surge normalizes.
Within Concentrates, the brand sits at rank 48 in California, so a 68.31% mix loaded into a mid-table position introduces share-concentration risk if state-level discovery stalls, while the 31.69% Vapor Pens share provides price-led cushioning. With brand sales up 65.29% YoY against a 56.998% decline over 24 months, the juxtaposition signals a rebuilding cycle where the July 2026 spike requires conversion into steadier cross-category penetration to avoid over-dependence on Concentrates momentum in California.
Competitive Landscape
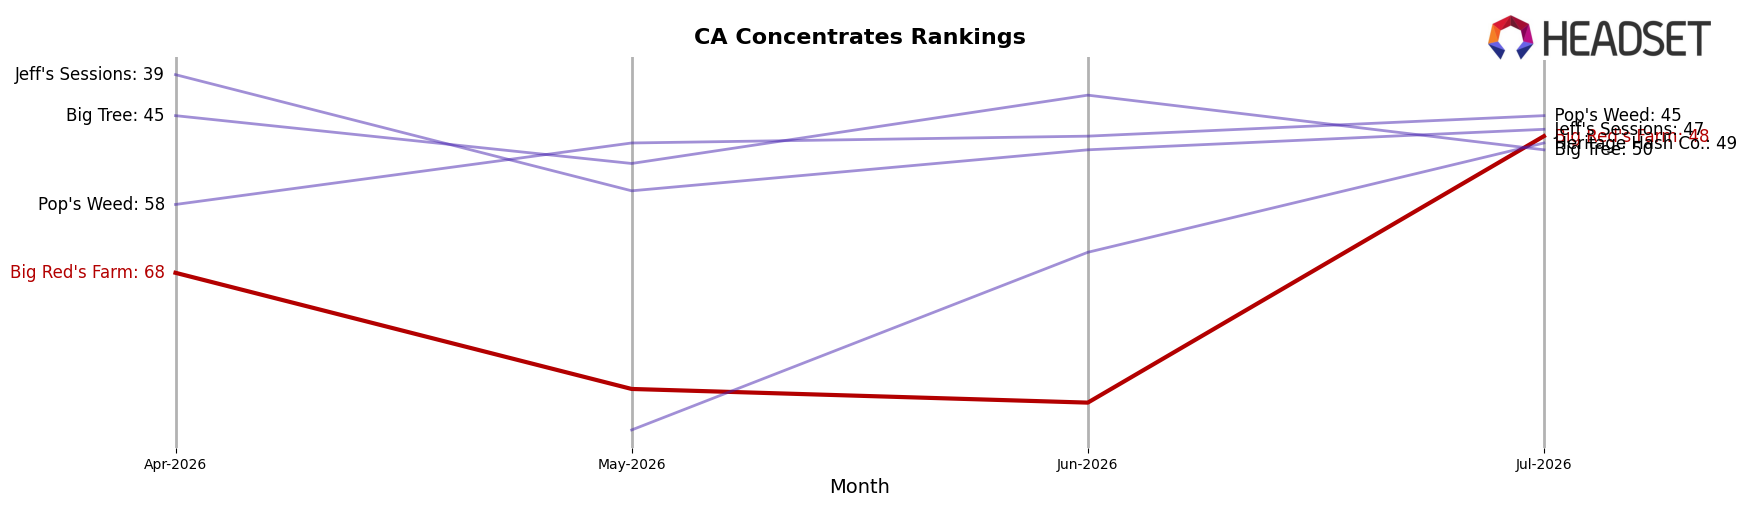
Big Red's Farm sits at rank #48 in CA Concentrates in July 2026, improving 18 positions year over year from #66, and it also moved up 20 spots from #68 three months ago, while still far from its peak at #20 in October 2024; meanwhile, Raw Garden held #1 year over year and remains #1 with +14.2% YoY sales, and 710 Labs climbed from #4 to #3 with +15.9% YoY sales as Punch Extracts / Punch Edibles slipped from #3 to #4 with -21.1% YoY sales; with this mid-pack ascent and competitor churn at the top, the trajectory indicates a recovery phase where sustained share capture is plausible if July 2026 momentum persists.
Notable Products
Prickly Pear Cured Resin (1g) delivered the standout move in July 2026 with a 678% month-over-month surge to rank 4, while 19th Hole Cured Resin (1g) followed with a 628% jump to rank 1 and Runtz Sauce (1g) climbed 271% to rank 2. Four of the top ten are Concentrates SKUs, and that concentration at ranks 1 through 4 signals a pivot toward solvent-based and rosin-led formats over Vapor Pens at ranks 5 and 8. The top three gains over +250% compressed share into the Concentrates block, implying Big Red's Farm is leaning into rapid-replenish drops and limited-batch profiles to anchor the leaderboard and pull demand away from steady but slower-moving pens.
Top Selling Cannabis Brands






Data for this report comes from real-time sales reporting by participating cannabis retailers via their point-of-sale systems, which are linked up with Headset’s business intelligence software. Headset’s data is very reliable, as it comes digitally direct from our partner retailers. However, the potential does exist for misreporting in the instance of duplicates, incorrectly classified products, inaccurate entry of products into point-of-sale systems, or even simple human error at the point of purchase. Thus, there is a slight margin of error to consider. Brands listed on this page are ranked in the top twenty within the market and product category by total retail sales volume.

