Jun-2026
Sales
Trend
6-Month
Product Count
SKUs
Avg Price
YoY Sales Change
YoY Price Change
Market Insights Snapshot
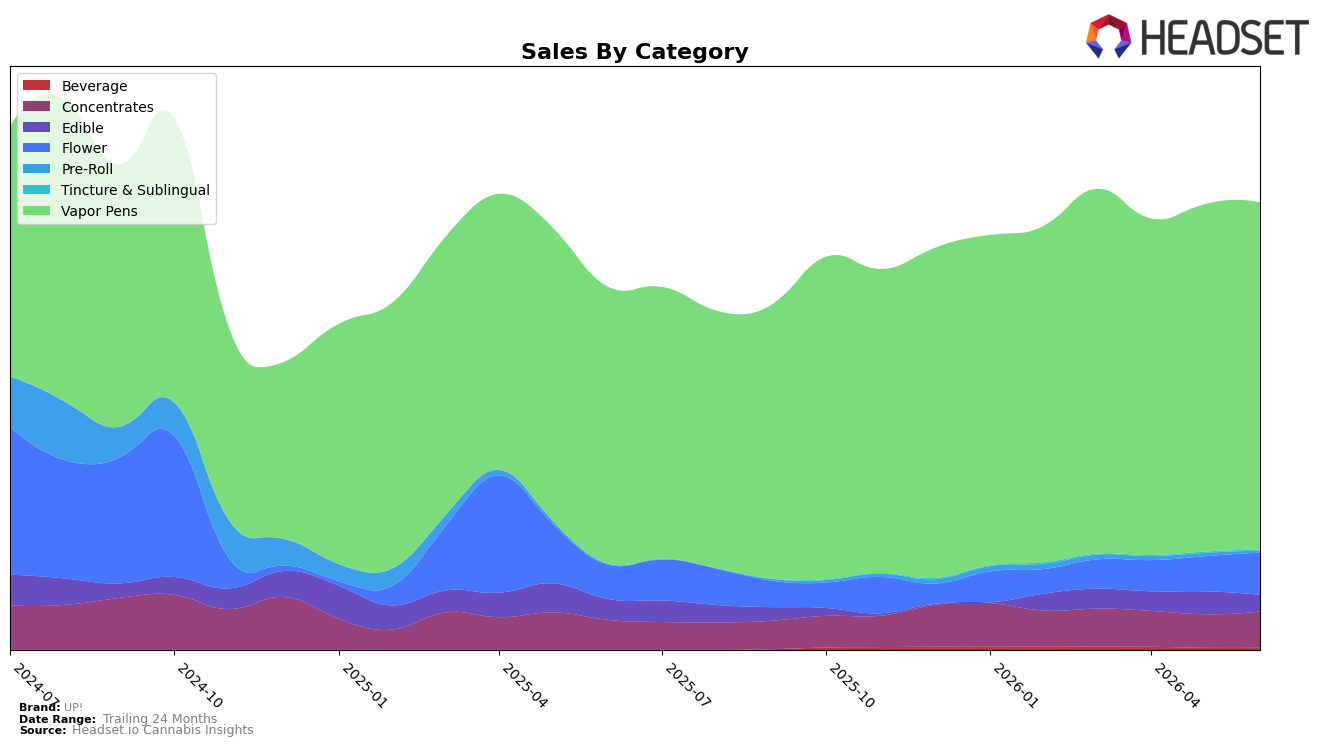
UP! concentrated 77.93% of June 2026 sales in Vapor Pens, where year-over-year growth was 25.58% and month-over-month change was 0.03%, while Flower held 9.41% share with 23.21% YoY and 20.73% MoM growth. Concentrates accounted for 8.06% share with 21.33% YoY and 8.11% MoM gains, contrasting with Edible at 3.65% share, down 20.81% YoY and 27.93% MoM; Pre-Roll’s 0.34% share paired 242.84% YoY with a 50.83% MoM decline. Average price fell 5.85% YoY to $11.11, concentrated in a $10.63 Vapor Pen price point and a $27.99 Flower price point, and the brand ranked 18 in Vapor Pens in California. The pattern implies UP! is doubling down on Vapor Pens while selectively reigniting Flower and Concentrates as secondary pillars, and is exiting or deprioritizing Edible and Tincture & Sublingual despite isolated spikes in Pre-Roll.
The mix shift supports a price-led, inhalables-first positioning: a 5.85% YoY price decline alongside a 25.58% YoY lift in the 77.93%-share Vapor Pens suggests a deliberate value posture, while 20.73% MoM in Flower and 8.11% MoM in Concentrates indicate targeted replenishment to defend cross-category baskets. With Edible contracting 27.93% MoM and Tincture & Sublingual down 32.72% MoM at sub-1% shares, UP! is narrowing focus to defend its rank 18 foothold in California Vapor Pens and to build a two-tier portfolio where Vapor Pens anchor volume and Flower/Concentrates provide margin balance.
Competitive Landscape
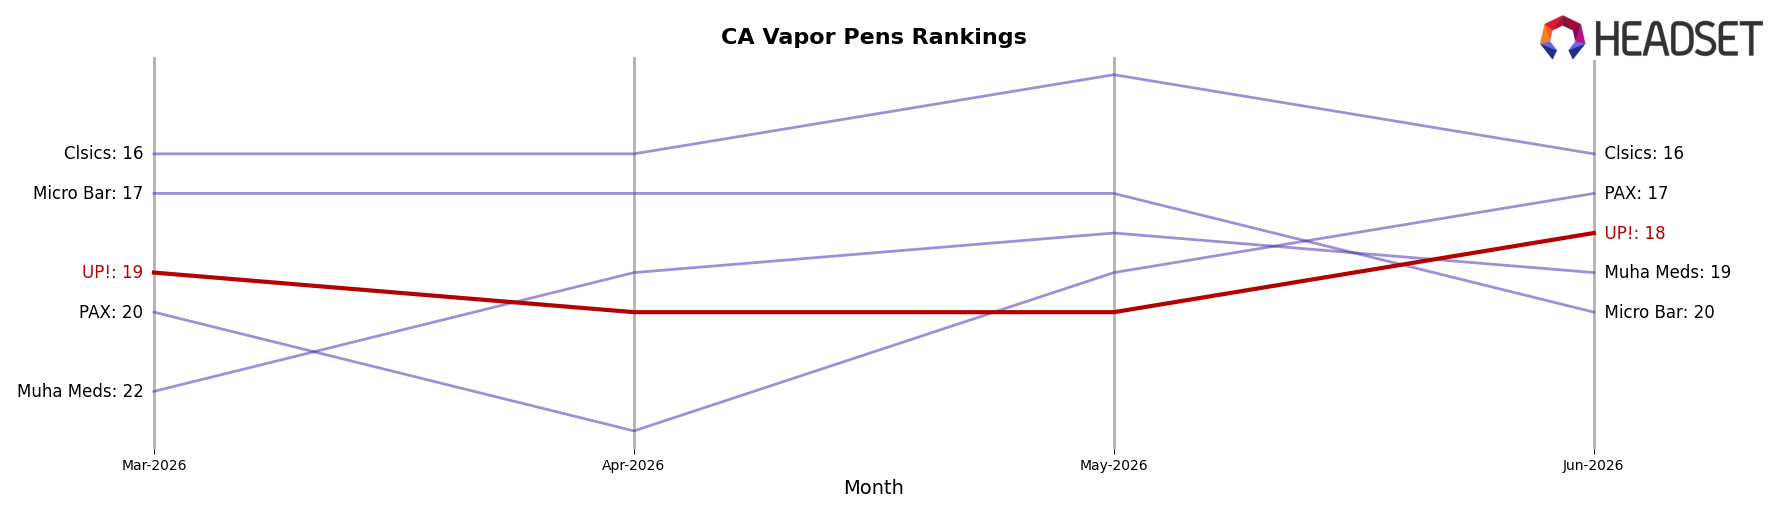
UP! sits at rank #18 in CA Vapor Pens in June 2026, improving 7 positions from #25 year over year and edging 1 spot ahead of its March 2026 position at #19; this is also its peak rank, indicating a local high-water mark. In the competitive set, STIIIZY held #1 year over year but faced a -6.95% sales change while Jetty Extracts climbed from #5 to #3 with a 47.32% YoY increase, and Plug Play slid from #3 to #4 with a -6.98% YoY change; against that backdrop, UP!’s rise from #25 to #18 alongside a one-rank uplift versus March 2026 implies momentum built on incremental share capture rather than category-wide tide.
Notable Products
Mango Kush Live Resin Cartridge (1g) led June 2026 with a -56% month-over-month drop at rank 1, while Blue Dream Live Resin Cartridge (1g) rose +78% to rank 2, creating a widening gap in momentum at the very top. Watermelon Z Live Resin Cartridge (1g) fell -11% at rank 4 and Strawberry Cough Live Resin Cartridge (1g) declined -14% at rank 6, whereas Gorilla Glue Live Resin Cartridge (1g) slid -45% at rank 9, reinforcing a split between one high-growth SKU and multiple double-digit decliners. With all ten top SKUs in Vapor Pens and a single SKU accounting for $158,529 despite contraction, the mix implies UP! is concentrated in a category where leadership depends on a single flagship being offset by selective challengers scaling rapidly.
Top Selling Cannabis Brands
Data for this report comes from real-time sales reporting by participating cannabis retailers via their point-of-sale systems, which are linked up with Headset’s business intelligence software. Headset’s data is very reliable, as it comes digitally direct from our partner retailers. However, the potential does exist for misreporting in the instance of duplicates, incorrectly classified products, inaccurate entry of products into point-of-sale systems, or even simple human error at the point of purchase. Thus, there is a slight margin of error to consider. Brands listed on this page are ranked in the top twenty within the market and product category by total retail sales volume.

