.svg)
Sep-2026
Sales
Trend
6-Month
Product Count
SKUs
Avg Price
YoY Sales Change
YoY Price Change


Where to Buy
Bite is stocked at 34 licensed dispensaries across Pennsylvania, Maryland, and 2 other states, 14 of them in Pennsylvania, with the deepest coverage in Philadelphia, Ardmore, Bethlehem, Bristol, and Chambersburg. Search by ZIP code or city below to find the closest one, or filter by product type if you are after a specific format.
Market Insights Snapshot
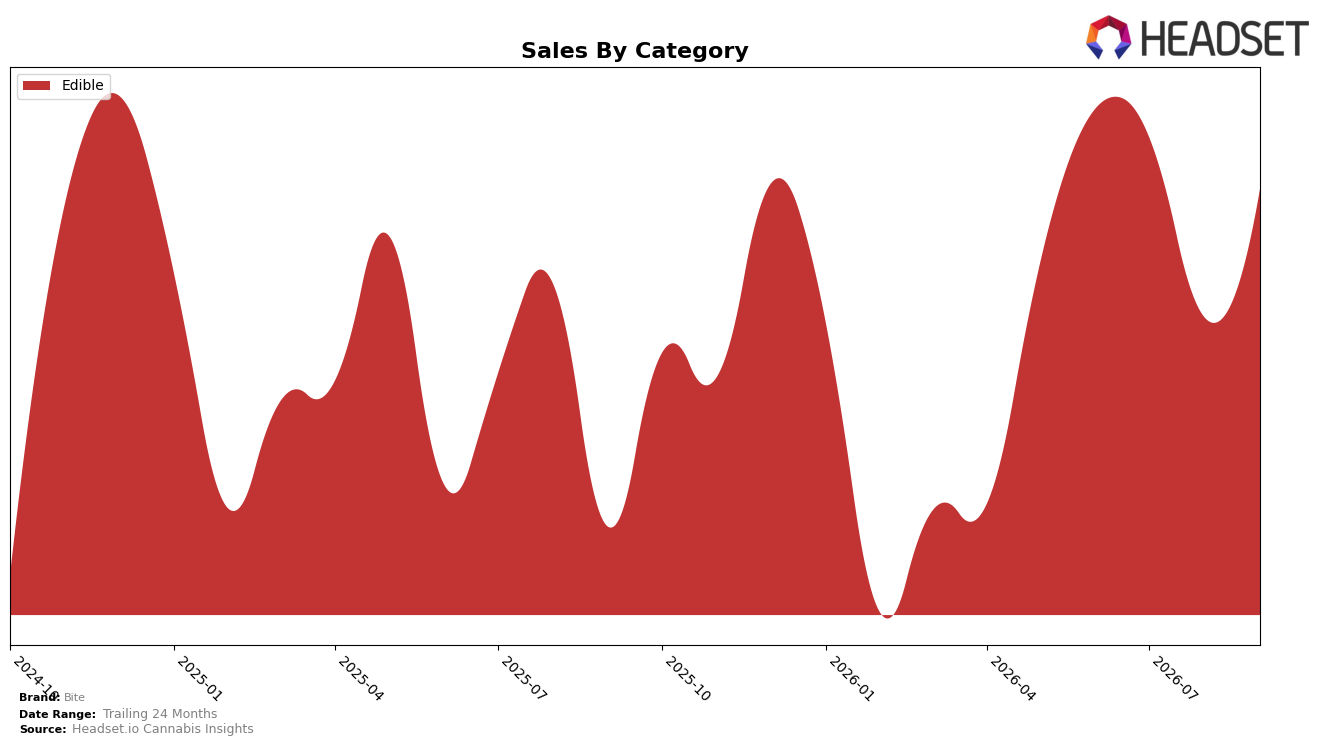
In September 2026, Bite operated as a single-category brand with Edible accounting for 100.0% of sales, posting 28.4% year-over-year growth and 9.19% month-over-month expansion. Within Massachusetts Edible, Bite held rank 19, while average price declined 17.98% YoY to $14.58 alongside a 9.19% MoM volume lift implied by the sales uptick, indicating a price-led demand response. The pattern implies Bite is consolidating its Edible focus: expanding share of wallet within the segment rather than diversifying, and using price elasticity to convert traffic into higher unit throughput at a mid-pack ranking.
The combination of a 28.4% YoY sales increase with a 17.98% YoY price decline and a rank of 19 in Massachusetts Edible suggests the brand is positioned as a value-leaning Edible play prioritizing unit velocity over premium margin capture. With MoM sales up 9.19% against stable single-category concentration at 100.0%, the current stance implies headroom to climb from rank 19 by continuing to trade price for volume, though sustained margin pressure may cap step-ups unless mix or pricing strategy shifts toward higher-priced Edible subtypes.
Competitive Landscape
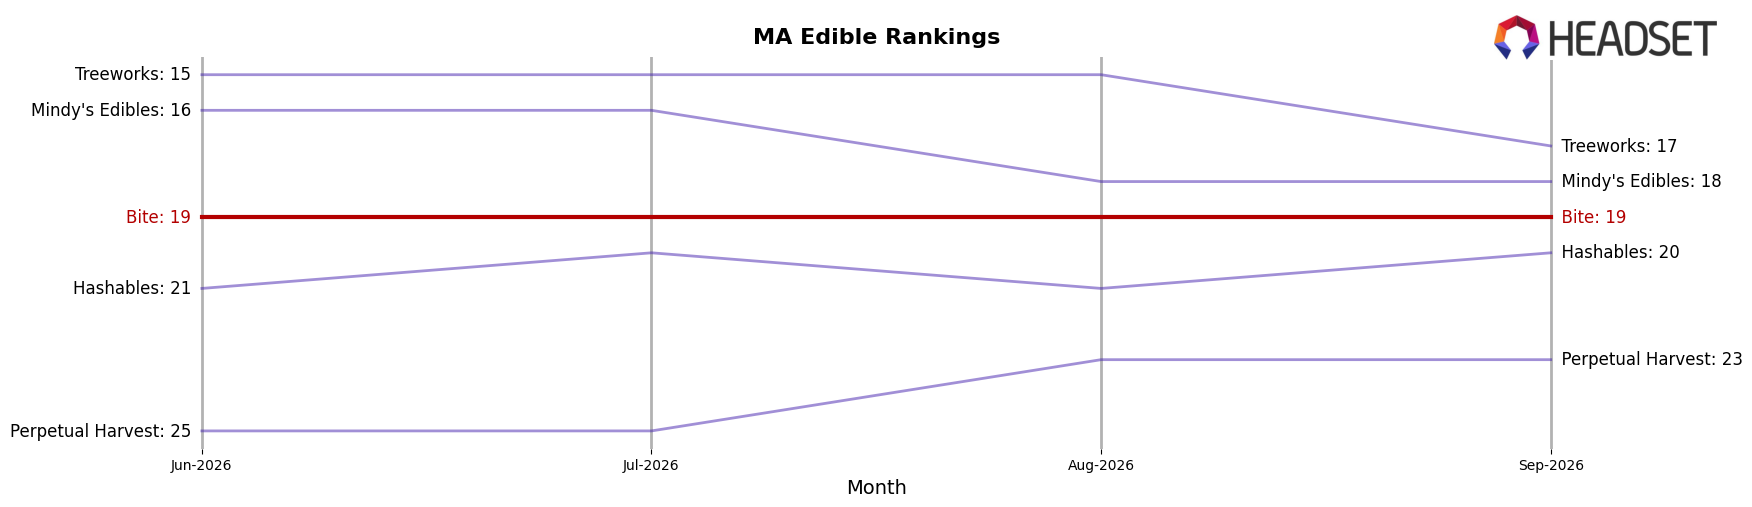
Bite sits at rank #19 in MA Edible in September 2026, down 1 position year over year from #18, while holding flat versus June 2026 at #19 and trailing its peak of #17 from December 2025; in contrast, Camino advanced from #3 to #1 with a 34.8% YoY sales increase and Kanha / Sunderstorm slipped from #1 to #2 despite a 7.8% YoY gain, with Wyld climbing from #4 to #3 on 11.8% growth and Betty's Eddies easing from #5 to #4 amid a -1.1% decline; this mix of upward mobility among top rivals and Bite’s 1-rank YoY erosion indicates Bite is ceding relative position in a segment where modest double-digit growth is sufficient to gain ranks, implying that without a step-change in velocity or distribution, Bite’s trajectory points to further mid-pack drift rather than recovery.
Notable Products
Dark Chocolate With Himalayan Salt 20-Pack (100mg) posted the steepest move in September 2026 with a -48.2% MoM drop and slid to rank 6, while Sleepy Blue Raspberry Gummies 20-Pack (100mg CBD, 100mg THC, 40mg CBN) climbed 29.8% MoM to rank 1. Social Watermelon Gummies 20-Pack (100mg THC, 20mg CBG, 20mg CBC) was essentially flat at +0.3% MoM at rank 2, and Mellow Meyer Lemon Gummies 20-Pack (100mg THC, 500mg CBD, 20mg CBC) edged up 4.2% MoM at rank 3. With all top-10 presence concentrated in Edibles and four SKUs holding ranks 1–4, the mix points to Bite leaning into gummy-led volume while de-prioritizing non-gummy formats.
Top Selling Cannabis Brands






Data for this report comes from real-time sales reporting by participating cannabis retailers via their point-of-sale systems, which are linked up with Headset’s business intelligence software. Headset’s data is very reliable, as it comes digitally direct from our partner retailers. However, the potential does exist for misreporting in the instance of duplicates, incorrectly classified products, inaccurate entry of products into point-of-sale systems, or even simple human error at the point of purchase. Thus, there is a slight margin of error to consider. Brands listed on this page are ranked in the top twenty within the market and product category by total retail sales volume.

