.svg)

Sep-2026
Sales
Trend
6-Month
Product Count
SKUs
Avg Price
YoY Sales Change
YoY Price Change



Where to Buy
Encore Edibles is stocked at 430 licensed dispensaries across Illinois, New Jersey, and 8 other states, 121 of them in Illinois, with the deepest coverage in Chicago, Quincy, Schaumburg, Champaign, and Joliet. Search by ZIP code or city below to find the closest one, or filter by product type if you are after a specific format.
Market Insights Snapshot
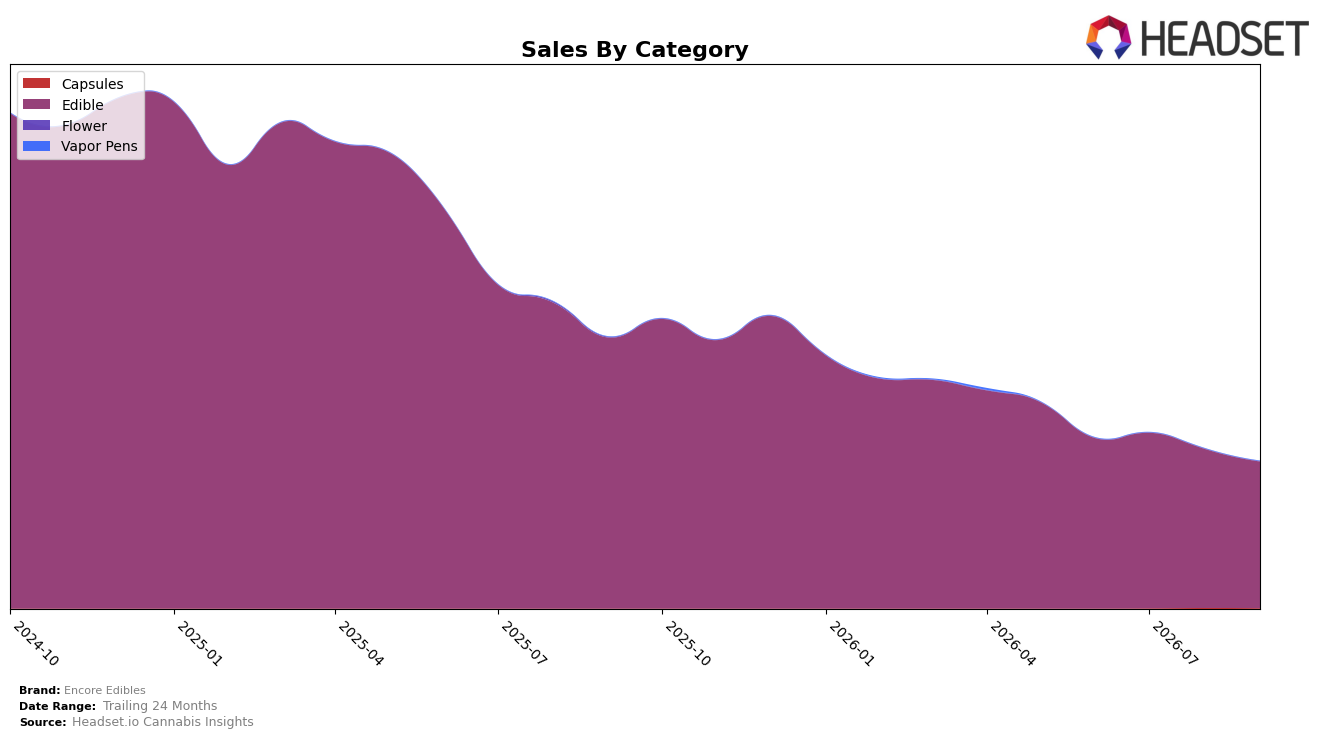
Encore Edibles concentrated 99.77% of September 2026 sales in Edible, with Capsules at 0.23% share, indicating a near-single-category footprint; within Edible the brand ranked 4 in Connecticut while category sales fell 45.95% year over year and 7.80% month over month. Average price declined 10.39% year over year to $18.80, while Capsules contracted 42.55% month over month from a minimal base, implying that September 2026 pressure was driven primarily by Edible volume/mix rather than pricing or diversification attempts.
The mix consolidation toward Edible at 99.77% share alongside a 45.95% year-over-year and 7.80% month-over-month drop suggests Encore Edibles is overexposed to Edible demand cycles, even as a 4th-place rank in Connecticut signals maintained visibility despite category headwinds. With Capsules at 0.23% share and a 42.55% month-over-month decline, the brand’s limited hedge against Edible volatility reduces shock absorption, implying that positioning should pivot toward stabilizing core Edible velocity and selectively testing adjacent formats rather than relying on price cuts alone given the 10.39% year-over-year price decrease already in market.
Competitive Landscape
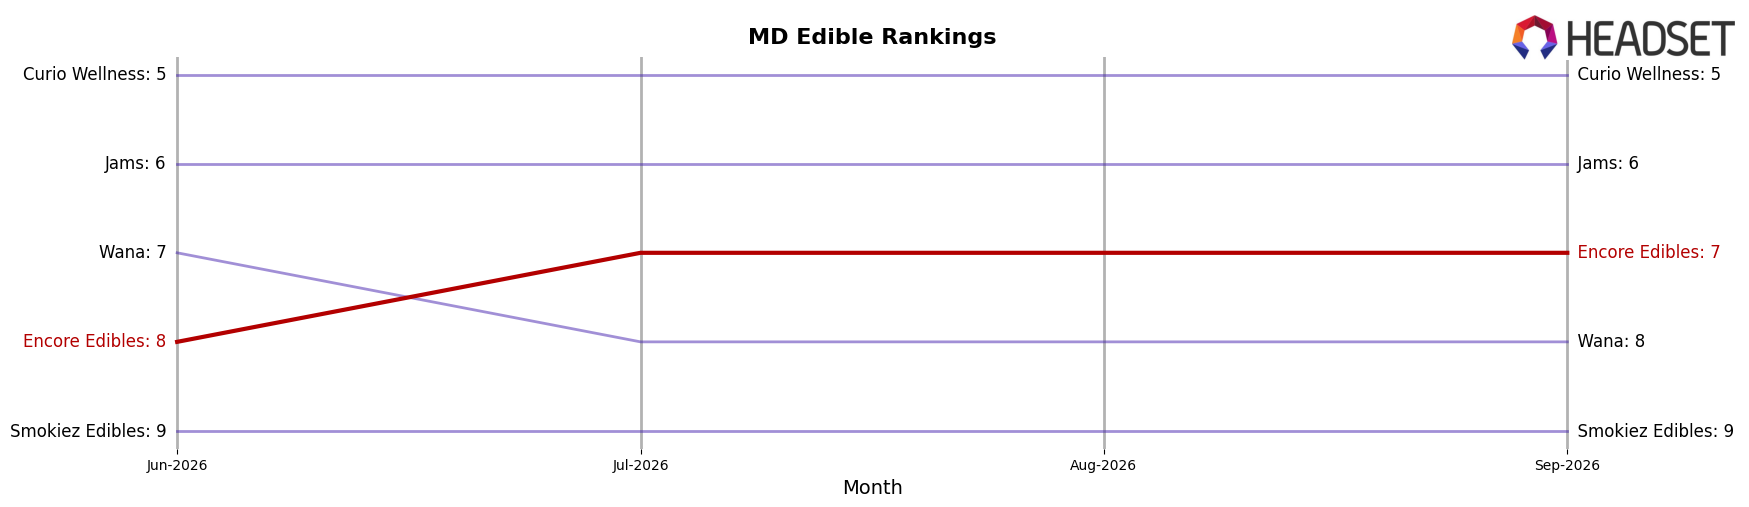
Encore Edibles sits at rank #7 in MD Edible for September 2026, down 4 spots from its peak at #3 in September 2025 but up 1 position versus June 2026’s #8, while its year-over-year rank is #3, indicating a 4-place gap between current and prior-year standing. Competitive movement is uneven: Incredibles climbed to #1 from #5 year over year with 58.1% sales growth, whereas Wyld slipped to #4 from #1 with a 32.9% sales decline; against this backdrop, Encore Edibles’ position at #7 alongside a prior peak at #3 signals a brand that has ceded ground to faster risers but remains within striking distance if it converts recent quarter-on-quarter stabilization into sustained share recovery.
Notable Products
Indica Sweet Berry Burst Gummies 5-Pack (50mg) posted the steepest move in September 2026 at -18.8% MoM while falling to rank 9, and Sativa Tropical Mango RSO Gummies 10-Pack (100mg) also contracted by -11.9% MoM yet held rank 1; this combination implies price-sensitive downsizing pressure alongside entrenched flagship demand. Hybrid Sour Black Cherry RSO Gummies 10-Pack (100mg) eased -4.4% MoM at rank 2 as Indica Sweet Berry Burst Gummies 10-Pack (100mg) advanced +9.1% MoM at rank 3, indicating the Indica format is gaining velocity against a softening hybrid leader. Eight of the top ten SKUs are Edible gummies, and two new CBD/THC ratio gummies entered the top 10 at ranks 7 and 8 with $70,769 and no reported MoM plus 8 at 66,098 respectively, signaling a pivot toward functional formulations even as classic fruit SKUs retain the top three ranks.
Top Selling Cannabis Brands






Data for this report comes from real-time sales reporting by participating cannabis retailers via their point-of-sale systems, which are linked up with Headset’s business intelligence software. Headset’s data is very reliable, as it comes digitally direct from our partner retailers. However, the potential does exist for misreporting in the instance of duplicates, incorrectly classified products, inaccurate entry of products into point-of-sale systems, or even simple human error at the point of purchase. Thus, there is a slight margin of error to consider. Brands listed on this page are ranked in the top twenty within the market and product category by total retail sales volume.

