Jun-2026
Sales
Trend
6-Month
Product Count
SKUs
Avg Price
YoY Sales Change
YoY Price Change
Market Insights Snapshot
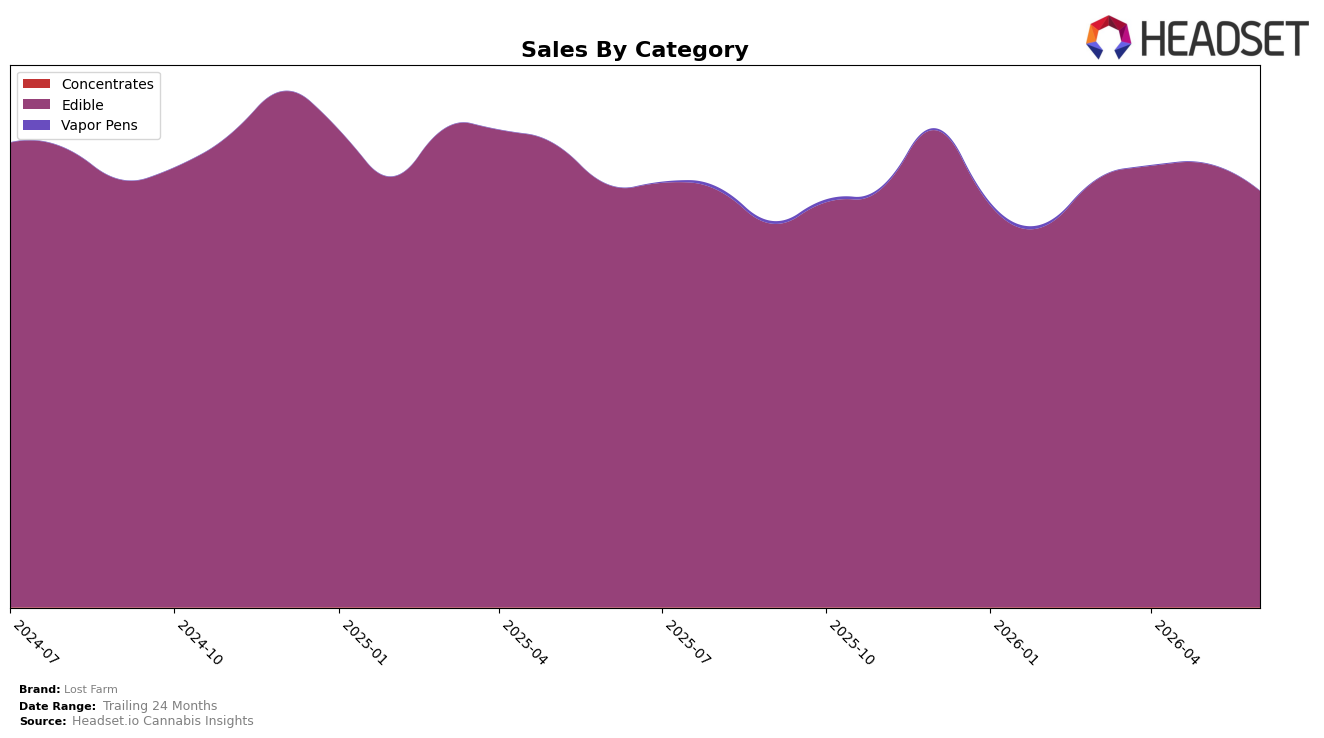
In June 2026, Lost Farm remained concentrated in Edible with a 99.97% mix, while Concentrates held 0.03% and climbed 12.11% month over month and 1,111.26% year over year; at the same time, Edible declined 6.20% MoM and 1.47% YoY. Overall brand sales were down 1.45% YoY against a 2.34% YoY decrease in average price, and Edible average price sat at $18.75 while Concentrates averaged $10.06. With rank 4 in Edible in California, the mix shift implies tiny but accelerating experimentation outside Edible even as the core category softens sequentially, pointing to a deliberate hedge rather than a pivot.
The combination of a 6.20% MoM pullback in Edible alongside a 12.11% MoM gain in Concentrates, despite Concentrates representing only 0.03% share, indicates incremental portfolio optionality without diluting the Edible-focused identity that supports a rank of 4 in California. With brand sales down 1.45% YoY against a 1.47% YoY Edible contraction and a 2.34% YoY price decrease, the pricing relief is not yet translating to volume recapture, implying that June 2026 positioning hinges on defending Edible velocity while using low-base Concentrates growth to test demand elasticity at a lower price tier.
Competitive Landscape
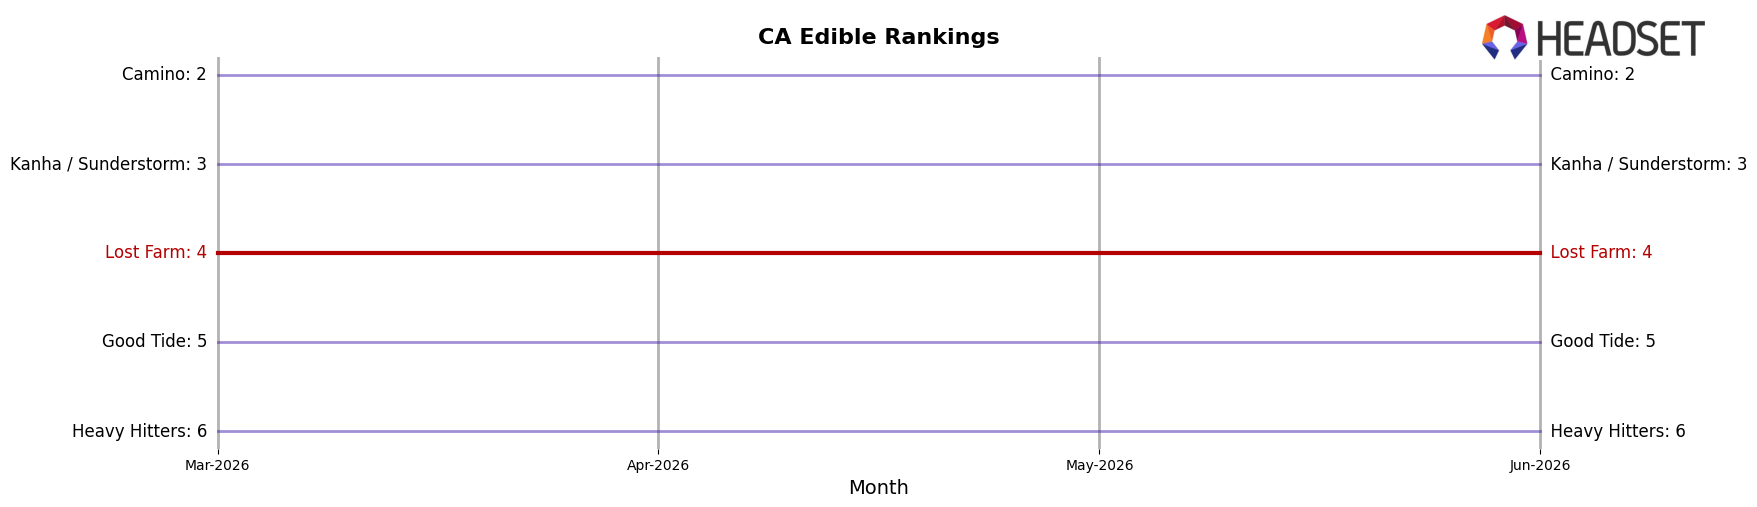
Lost Farm ranks #4 in California Edible for June 2026, unchanged from #4 in June 2025, while its peak rank also sits at #4 in June 2026, indicating a flat rank trajectory even as category dynamics shift; by comparison, Wyld held #1 year over year but posted a -1.9% sales change, and Camino stayed at #2 with +12.9% sales growth, with Kanha / Sunderstorm steady at #3 and +10.9%, and Good Tide at #5 with +28.5%; the pattern implies Lost Farm is holding share against top-three incumbents despite positive momentum below it, which signals stability at #4 but rising pressure from faster-growing brands.
Notable Products
Cherry Lime x GMO Live Rosin Chews 10-Pack (100mg) posted the steepest decline at -20.3% month over month while sitting at rank 7, and Dark Cherry x Illuminati OG Live Rosin Gummies 10-Pack (100mg) fell -16.5% at rank 9, indicating Live Rosin SKUs underperformed relative to Live Resin leaders. Blueberry x Blue Dream Live Resin Fruit Chews 10-Pack (100mg) held rank 1 despite a -8.7% dip, and Strawberry Lemonade x Super Lemon Haze Live Resin Gummies 10-Pack (100mg) stayed at rank 2 with a -0.3% change, so leadership remains concentrated in Live Resin formats. With ten of the top ten in Edibles and at least six carrying Live Resin positioning, the mix favors terpene-forward fruit chews and gummies over Live Rosin, implying Lost Farm’s near-term commercial direction leans into maintaining Live Resin dominance while reevaluating underperforming Rosin variants.
Top Selling Cannabis Brands
Data for this report comes from real-time sales reporting by participating cannabis retailers via their point-of-sale systems, which are linked up with Headset’s business intelligence software. Headset’s data is very reliable, as it comes digitally direct from our partner retailers. However, the potential does exist for misreporting in the instance of duplicates, incorrectly classified products, inaccurate entry of products into point-of-sale systems, or even simple human error at the point of purchase. Thus, there is a slight margin of error to consider. Brands listed on this page are ranked in the top twenty within the market and product category by total retail sales volume.

