Jun-2026
Sales
Trend
6-Month
Product Count
SKUs
Avg Price
YoY Sales Change
YoY Price Change
Market Insights Snapshot
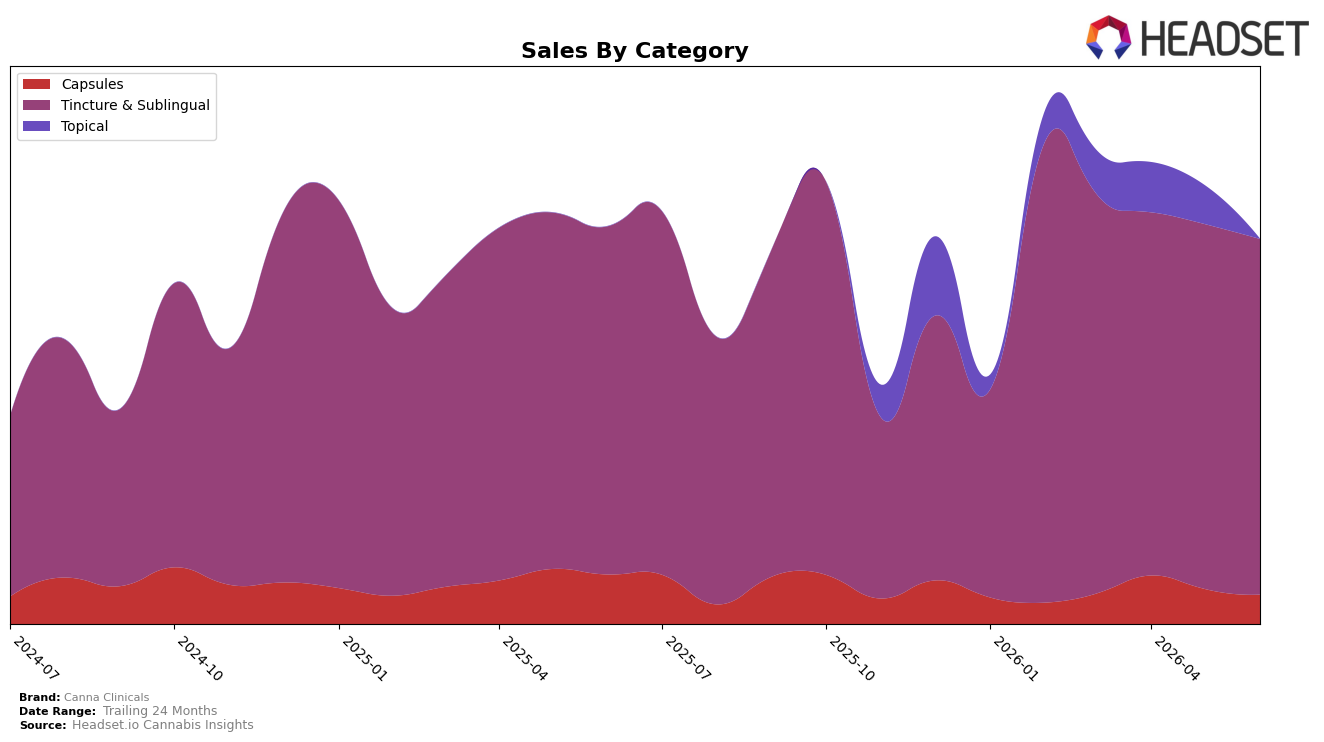
Canna Clinicals concentrated 92.47% of June 2026 sales in Tincture & Sublingual, where year-over-year growth was 2.11% despite a month-over-month dip of 2.53%, while Capsules fell to 7.53% share with a 41.07% year-over-year decline and a 16.42% month-over-month drop. Average price slid 31.75% year over year to $35.83, with Tincture & Sublingual pricing at $37.99 versus Capsules at $21.08, and the brand held rank 9 in Tincture & Sublingual in New York. The pattern points to a single-category anchor propping up overall sales as Capsules contract, implying the brand is trading volume for price in its core while exiting price-sensitive formats.
With 92.47% dependence on Tincture & Sublingual and a rank of 9 in New York, the brand’s positioning is specialized rather than diversified, gaining modest year-over-year traction of 2.11% in its core while ceding ground month over month by 2.53%. The 31.75% year-over-year price compression alongside a 41.07% Capsules decline and 16.42% month-over-month erosion indicates elasticity-driven share defense in the core and diminished relevance in Capsules. This implies a need to defend the top-10 slot by reinforcing core differentiation while selectively pruning or redefining Capsules to prevent further drag on mix efficiency.
Competitive Landscape
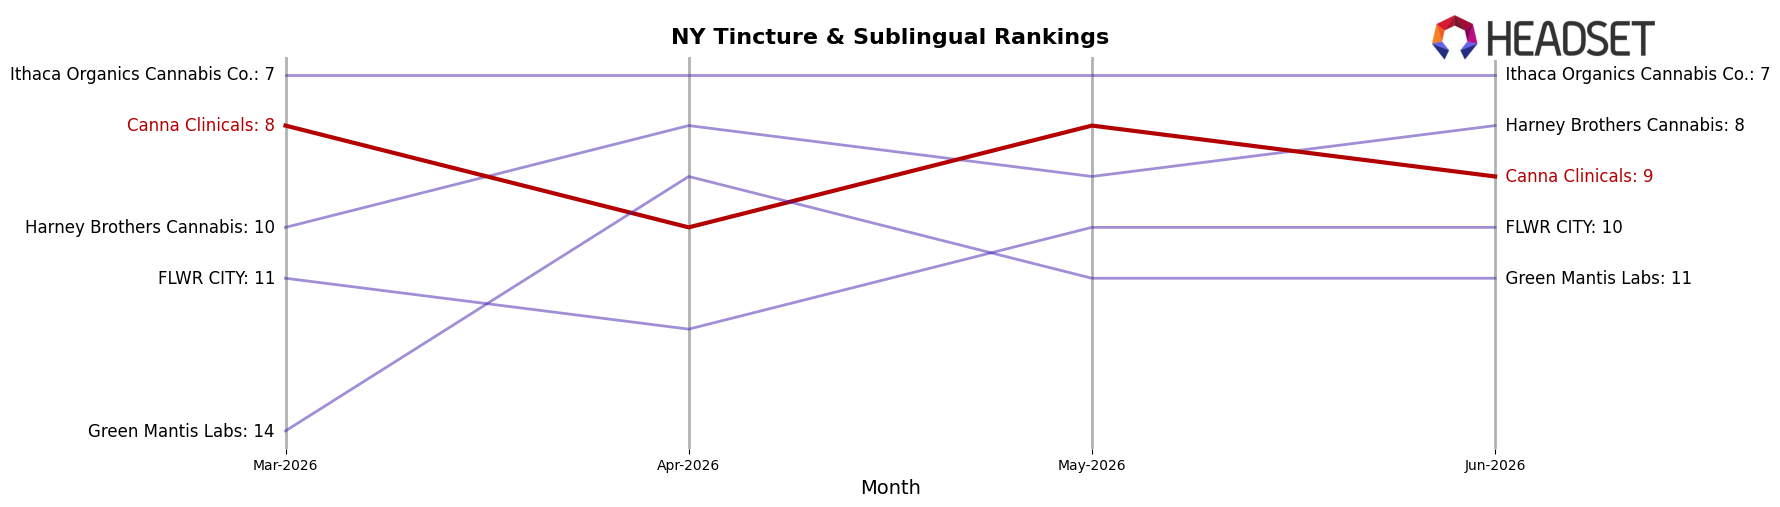
Canna Clinicals sits at rank #9 in New York Tincture & Sublingual for June 2026, unchanged from #9 year over year, after slipping from #8 three months ago and off a prior peak of #6 in July 2024; this flat YoY rank alongside a one-spot drop since March 2026 indicates stalled relative momentum despite historical headroom. Competitive movement is mixed: Veterans Choice Creations (VCC) improved from #5 to #4 with a 20.8% YoY sales increase, while Head & Heal held #2 with a -16.3% YoY sales change and OMO - Open Minded Organics advanced from #7 to #5 on essentially flat 0.0% YoY growth; relative to these shifts, holding #9 while peers move up or down suggests Canna Clinicals is neither being displaced by accelerating rivals nor capitalizing on peers’ contractions, implying a balance point where minor share gains or assortment changes could convert stagnation into upward rank mobility.
Notable Products
CBD/THC/CBN 1:1:1 Sleep Complex Capsules 20-Pack (100mg CBD, 100mg THC, 100mg CBN) posted the steepest drop at -85.3% and slid to rank 6, while CBD/THC/CBG1:1:1 Relief Complex Capsules 20-Pack (100mg CBD, 100mg THC, 100mg CBG) surged +91.0% into rank 5, implying a sharp substitution within the capsules lineup toward daytime relief over sleep use. The CBD/THC 1:10 Max Strength Tincture (100mg CBD, 1000mg THC, 30ml) rose +27.4% to rank 1 and concentrated revenue with roughly $25,362, while the CBD/THC Unwind Tincture (1050mg CBD, 90mg THC, 15ml) fell -44.1% at rank 2 and the CBD/CBN/THC Sleep Tincture (300mg CBD, 300mg CBN, 150mg THC) declined -28.4% at rank 3. Three of the top three products are Tincture & Sublingual SKUs and two of the top six are Capsules, with rises at rank 1 and rank 5 offset by double-digit declines at ranks 2, 3, and 4, indicating a tilt toward a single flagship tincture plus a niche relief capsule rather than balanced breadth.
Top Selling Cannabis Brands
Data for this report comes from real-time sales reporting by participating cannabis retailers via their point-of-sale systems, which are linked up with Headset’s business intelligence software. Headset’s data is very reliable, as it comes digitally direct from our partner retailers. However, the potential does exist for misreporting in the instance of duplicates, incorrectly classified products, inaccurate entry of products into point-of-sale systems, or even simple human error at the point of purchase. Thus, there is a slight margin of error to consider. Brands listed on this page are ranked in the top twenty within the market and product category by total retail sales volume.

