Jun-2026
Sales
Trend
6-Month
Product Count
SKUs
Avg Price
YoY Sales Change
YoY Price Change
Market Insights Snapshot
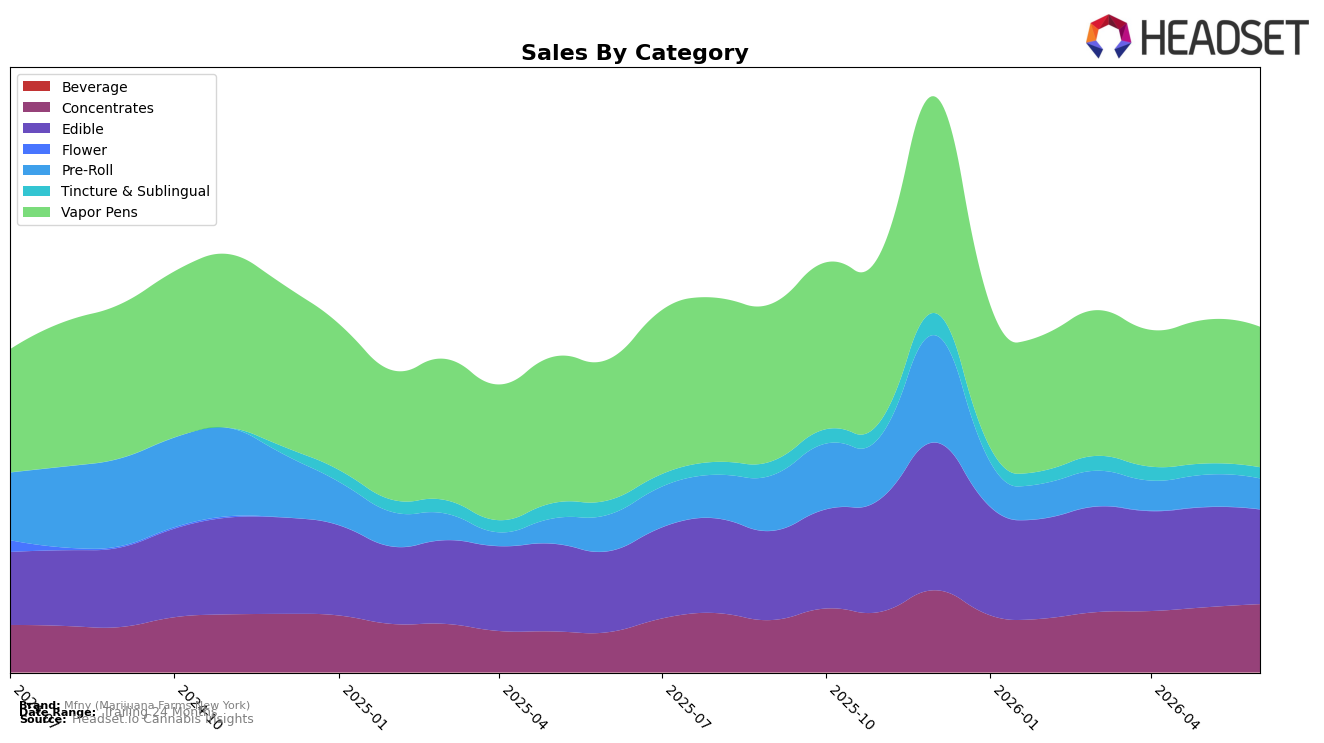
Mfny (Marijuana Farms New York) exited June 2026 with Vapor Pens at 40.73% mix and a rank of 6 in New York Vapor Pens, while category sales in that lane slipped 0.32% YoY and 2.21% MoM, indicating share is anchored by scale rather than current momentum. Edible held 27.41% mix with sales up 17.05% YoY but down 5.44% MoM, contrasting with Concentrates at 19.76% mix posting 70.06% YoY growth and 4.94% MoM growth. Pre-Roll at 8.88% mix declined 15.44% YoY and 4.27% MoM, and Tincture & Sublingual at 3.19% mix fell 22.80% YoY and 0.61% MoM, while Flower is negligible at 0.02% mix with a 44.62% MoM drop. The pattern implies a tilt toward higher-velocity inhalables where Concentrates are comping up, even as the Vapor Pens anchor softens, pointing to a mix that can support total-brand YoY growth of 10.45% despite a 19.73% YoY drop in average price.
The shift toward Concentrates growth of 70.06% YoY alongside a 4.94% MoM increase, against a 0.32% YoY and 2.21% MoM contraction in Vapor Pens, suggests positioning that leans into potency-led consumers rather than flavor-led or format-convenience seekers. With Edible adding 17.05% YoY but retrenching 5.44% MoM, and Pre-Roll shrinking 15.44% YoY, the brand’s defensible space is breadth within inhalables where rank 6 in New York Vapor Pens provides distribution reach while Concentrates supply the incremental growth engine. Given total sales up 10.45% YoY and average price down 19.73% YoY, the mix indicates a volume-acquisition stance: maintaining top-of-funnel via Vapor Pens while migrating value-seeking buyers into higher-ticket Concentrates, a posture that favors share stability if Vapor Pens slide remains shallow and Concentrates sustain double-digit MoM gains.
Competitive Landscape
Mfny (Marijuana Farms New York) sits at rank #6 in NY Vapor Pens for June 2026, down 1 position year over year from #5 and slipping 2 spots from its peak rank of #4 in May 2026; meanwhile, category leaders moved in opposite directions as Fernway climbed from #3 to #2 with 40.0% YoY sales growth and Ayrloom fell from #2 to #3 with a -19.6% YoY decline, while Jetty Extracts surged from #23 to #5 on 238.2% YoY growth and Florist Farms advanced from #6 to #4 with 38.7% YoY growth; with the market concentrating around fast-rising players and the top spot held by Jaunty steady at #1 despite an -18.1% YoY decline, the shift from #4 in May 2026 to #6 in June 2026 implies Mfny’s rank trajectory is vulnerable to share capture by momentum brands unless mix or velocity changes reverse the two-position slide.

Notable Products
Pina Colada x Strawpaya Live Resin Gummies 10-Pack (100mg) posted the standout movement in June 2026 with a +114% month-over-month surge to rank 3, while Honey Banana Live Rosin Cartridge (0.5g) fell -16% to rank 6. Pink Lemonade x Lemon Cane Live Resin Gummies 10-Pack (100mg) declined -34% yet held rank 4, and Sour Fruit Punch x Lemon Sour Dawg Live Resin Gummies 10-Pack (100mg) also dropped -35% at rank 8. With five of the top ten coming from Edibles and only two Vapor Pens in the top ten, the mix points to a pivot toward flavor-led, live-resin edibles while cartridges cede share, implying near-term focus on edible innovation over vape volume.
Top Selling Cannabis Brands
Data for this report comes from real-time sales reporting by participating cannabis retailers via their point-of-sale systems, which are linked up with Headset’s business intelligence software. Headset’s data is very reliable, as it comes digitally direct from our partner retailers. However, the potential does exist for misreporting in the instance of duplicates, incorrectly classified products, inaccurate entry of products into point-of-sale systems, or even simple human error at the point of purchase. Thus, there is a slight margin of error to consider. Brands listed on this page are ranked in the top twenty within the market and product category by total retail sales volume.

