Jun-2026
Sales
Trend
6-Month
Product Count
SKUs
Avg Price
YoY Sales Change
YoY Price Change
Market Insights Snapshot
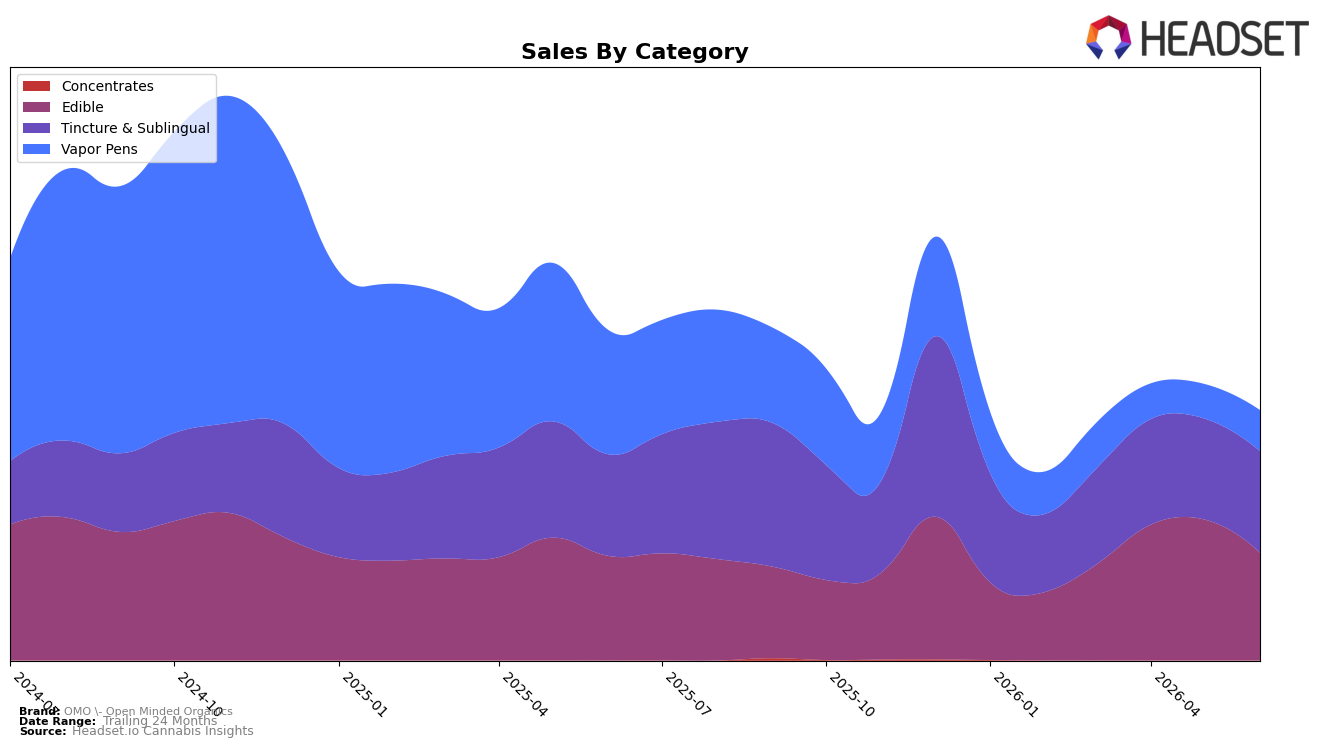
OMO - Open Minded Organics concentrated 83.7% of June 2026 sales in Edible and Tincture & Sublingual, with Edible at 43.05% share (ranked 34th in New York Edible) and Tincture & Sublingual at 40.61% share; yet Edible swung -23.60% MoM despite a 2.95% YoY rise, while Tincture & Sublingual inched +0.63% MoM with a flat +0.04% YoY. Vapor Pens held 16.34% share with a -67.14% YoY drop but a +18.98% MoM rebound, and the brand’s average price fell 11.32% YoY even as total brand sales declined 24.32% YoY; the pattern implies mix is tilting back toward lower-priced Edibles for volume stability while Vapor Pens provide short-term MoM lift without repairing the YoY hole.
The divergence—Edible down -23.60% MoM alongside a +2.95% YoY and Tincture & Sublingual flat YoY at +0.04% but slightly up +0.63% MoM—signals a repositioning window where pricing (down 11.32% YoY) is being used to defend share in value-leaning formats while higher-ticket Tincture & Sublingual sustains contribution. With Vapor Pens’ -67.14% YoY against +18.98% MoM, the implication is that OMO - Open Minded Organics can treat pens as a tactical promo-driven recapture lane, but the durable positioning sits in Edible and Tincture & Sublingual where consistent share (83.66% combined) can anchor recovery in New York despite a June 2026 Edible rank of 34.
Competitive Landscape
OMO - Open Minded Organics sits at rank #34 in NY Edible for June 2026, improving 1 spot year over year from #35 while climbing 7 positions versus the last three months from #41, indicating recent momentum despite being 11 ranks below its peak at #23 from June 2024. In the same June 2026 period, Off Hours slipped from #1 to #2 while Wyld held steady at #3 with 26.03% YoY sales growth, signaling that OMO - Open Minded Organics’ single-rank annual gain is modest relative to top-tier stability and upward pressure; this trajectory implies OMO - Open Minded Organics is re-entering the competitive mid-pack but must convert the recent 7-rank quarterly climb into sustained share capture to avoid stagnation below prior peak levels.

Notable Products
Sleepy Strawberry RSO Gummies 10-Pack (100mg) posted the steepest move in June 2026 with a -63.4% month-over-month drop, sliding to rank 4, while Blueberry RSO Gummies 10-Pack (100mg) fell -18.4% at rank 1. In contrast, Green Apple DSO Gummies 10-Pack (100mg) jumped +66.4% to rank 5, and Cherry Glurp RSO Distillate Cartridge (1g) rose +7.0% to rank 10. Five of the top ten are Edible SKUs, indicating the category still concentrates demand even as volatility widens between RSO and DSO lines. The pattern implies OMO - Open Minded Organics is being pulled toward stabilizing DSO-led Edible growth while RSO Gummies require near-term remediation to prevent further share erosion.
Top Selling Cannabis Brands
Data for this report comes from real-time sales reporting by participating cannabis retailers via their point-of-sale systems, which are linked up with Headset’s business intelligence software. Headset’s data is very reliable, as it comes digitally direct from our partner retailers. However, the potential does exist for misreporting in the instance of duplicates, incorrectly classified products, inaccurate entry of products into point-of-sale systems, or even simple human error at the point of purchase. Thus, there is a slight margin of error to consider. Brands listed on this page are ranked in the top twenty within the market and product category by total retail sales volume.

