Jun-2026
Sales
Trend
6-Month
Product Count
SKUs
Avg Price
YoY Sales Change
YoY Price Change
Market Insights Snapshot
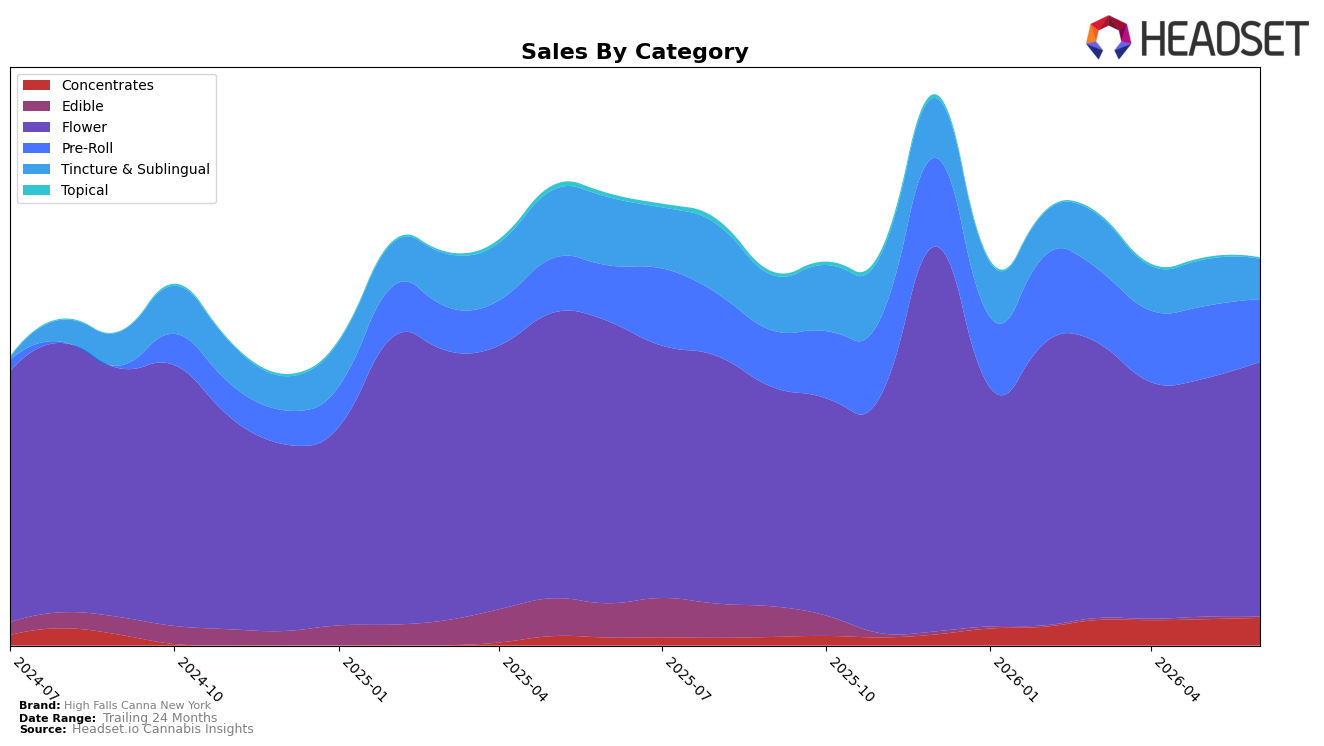
High Falls Canna New York concentrated 65.85% of June 2026 sales in Flower, where year-over-year sales fell 9.72% but month-over-month rose 6.95%, while Pre-Roll held 16.17% share with a 12.32% YoY gain offset by a 13.34% MoM decline. Tincture & Sublingual represented 10.38% share with a 40.94% YoY drop and a 13.59% MoM pullback, whereas Concentrates climbed to 7.08% share on a 252.69% YoY increase and a 4.88% MoM rise. Minor lines contracted sharply as Edible slid 96.94% YoY and 52.90% MoM to 0.27% share, and Topical fell 72.96% YoY and 42.90% MoM to 0.25% share. With an average price down 2.72% YoY to $25.92 and overall brand sales down 14.27% YoY despite 121.09% growth over 24 months, the mix implies a pivot toward core inhalables that cushions recent declines but does not fully offset weakness in wellness and ingestibles in New York.
Within Flower, a rank of 46 in New York positions the brand mid-to-lower tier, yet the 6.95% MoM rebound alongside a 4.88% MoM lift in Concentrates signals traction in higher-engagement formats even as Pre-Roll softness of 13.34% MoM and Tincture & Sublingual’s 13.59% MoM contraction pressure breadth. The 252.69% YoY surge in Concentrates against a 9.72% YoY dip in Flower indicates consumer migration toward potency-led options, while the 96.94% YoY collapse in Edible and 72.96% YoY decline in Topical reduce cross-category insulation. Net, the pattern implies that High Falls Canna New York’s near-term positioning depends on defending Flower share while scaling Concentrates to diversify revenue away from shrinking wellness and ingestible niches.
Competitive Landscape
High Falls Canna New York sits at rank #46 in June 2026, down 3 positions from #43 year over year, and 1 position softer than its March 2026 mark of #45; by contrast, category leaders shifted upward as Find. advanced from #3 to #1 and RYTHM moved from #10 to #5 while High Falls Canna New York remains 18 places below its July 2024 peak of #28. With Leal climbing from #7 to #2 amid 44.4% year-over-year sales growth and Dank. By Definition sliding from #1 to #3 on a 50.7% decline, the brand’s flat-to-declining rank suggests share is consolidating around faster-rising leaders and that holding position will require counteracting a two-year drift from peak to mid-pack.

Notable Products
OG Kush Pre-Roll 2-Pack (1g) posted the steepest decline in June 2026 at -50.4% MoM and slipped to rank 9, while Dynamic Doob- Hybrid Kief Infused Pre-Roll 2-Pack (1g) fell -25.3% to rank 8, signaling a pullback in infused and classic two-pack pre-roll momentum. In contrast, Sour Diesel x OG Kush (3.5g) jumped +28.1% MoM to rank 6 and Girl Scout Cookies X (3.5g) rose +13.8% while holding rank 1, indicating Flower is consolidating the top tier as Pre-Roll weakens. With four of the top ten in Flower and three in Pre-Roll, the balance tilts toward eighth- to first-rank Flower SKUs gaining share as second- and ninth-rank Pre-Rolls contract, implying assortment priority is shifting back to core eighths over bundled pre-roll formats. The commercial implication is a pivot toward high-velocity Flower anchoring visibility and margin, with pre-rolls requiring SKU rationalization rather than expansion.
Top Selling Cannabis Brands
Data for this report comes from real-time sales reporting by participating cannabis retailers via their point-of-sale systems, which are linked up with Headset’s business intelligence software. Headset’s data is very reliable, as it comes digitally direct from our partner retailers. However, the potential does exist for misreporting in the instance of duplicates, incorrectly classified products, inaccurate entry of products into point-of-sale systems, or even simple human error at the point of purchase. Thus, there is a slight margin of error to consider. Brands listed on this page are ranked in the top twenty within the market and product category by total retail sales volume.

