.svg)


Where to Buy
Canna Club is stocked at 17 licensed dispensaries across Colorado, with the deepest coverage in Denver, Colorado Springs, Durango, Fort Collins, and Golden. Search by ZIP code or city below to find the closest one, or filter by product type if you are after a specific format.
Market Insights Snapshot
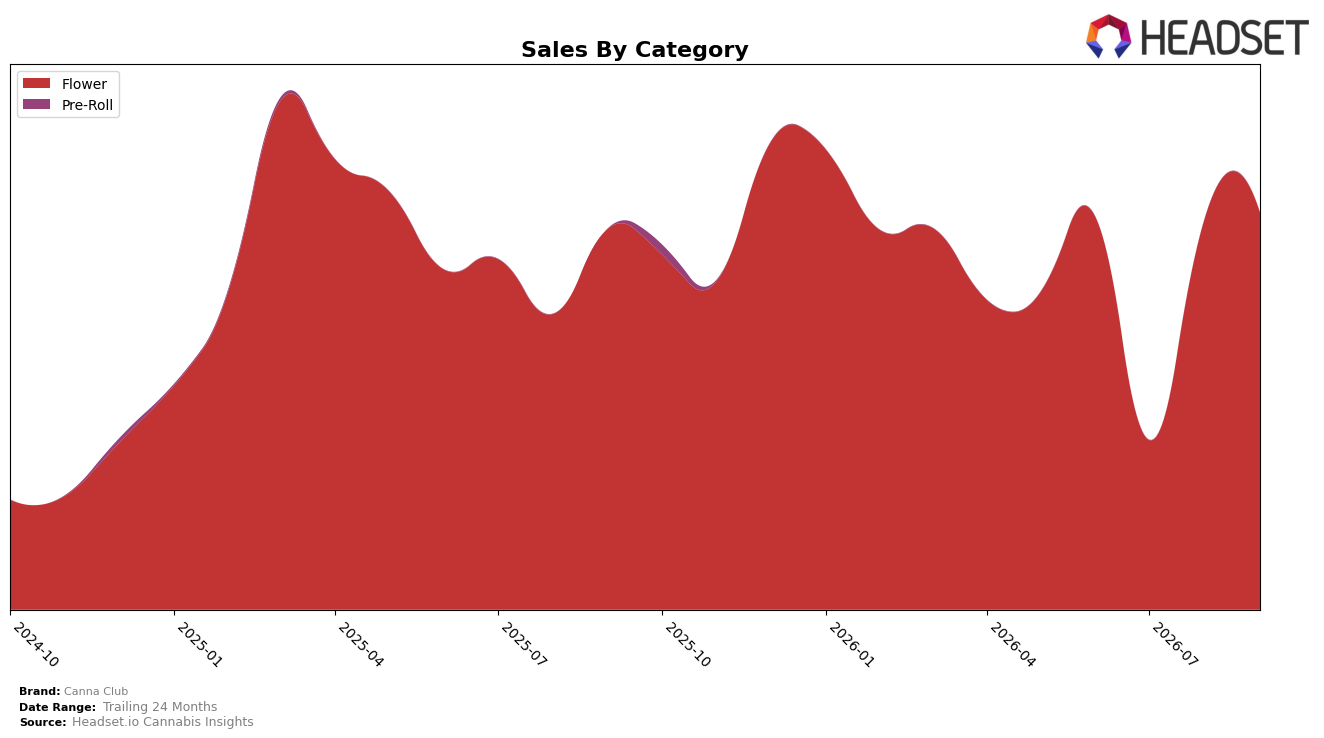
In September 2026, Canna Club’s category mix was fully concentrated in Flower at 100.0% share, with Flower sales up 4.15% year over year and 1.53% month over month, while the average price fell 13.79% YoY to $7.27. Within Colorado Flower, the brand held rank 28, indicating mid-pack placement despite positive YoY and MoM unit momentum; the pattern implies a volume-led model where price compression is trading for incremental share stability rather than rank gains.
The combination of a 100.0% Flower dependency and a 13.79% YoY price decline, alongside a 4.15% YoY sales increase and 1.53% MoM lift, implies Canna Club is leveraging price elasticity to protect throughput in Colorado. With rank 28 in Flower and all sales tied to a single category, the mix and pricing trajectory suggest a defensive positioning that prioritizes unit velocity over margin, implying that future rank improvement likely hinges on tactical price floors or diversification rather than further discount-led volume alone.
Competitive Landscape
Canna Club sits at rank #28 in CO Flower for September 2026, down 4 positions year over year from #24, and it also slipped 4 spots versus its three-month mark of #24; against this, Good Chemistry Nurseries moved up from #3 to #2 while reporting 45.48% YoY sales growth, and In The Flow advanced from #12 to #5 with 113.55% YoY sales growth. While Canna Club’s current #28 trails its historical peak of #18 in March 2025 by 10 positions and lags the #1 standing of Green Label Cannabis (steady at #1 with 38.04% YoY growth), the directional gains by rivals into the top 5 suggest that Canna Club’s multi-quarter rank erosion is tied less to absolute decline and more to outsized competitor momentum; the trajectory implies share pressure will persist unless the brand can reverse the 4-rank YoY slide and close the 10-position gap back to its peak.

Notable Products
Pablo's Revenge Popcorn (1g) posted the steepest shift with a -56.2% month-over-month change while holding rank 7, contrasting with Rainbow Zoap Popcorn (3.5g) jumping +90.0% to rank 6 and Strawberry Cheesecake (1g) rising +72.5% at rank 8. With all top-10 entries in Flower and three Popcorn SKUs clustered between ranks 1 and 8, mix is tilting toward value-oriented formats even as bulk retains presence at ranks 2 and 5. The coexistence of a -56.2% decline and a +90.0% surge within Popcorn points to rapid substitution within the lineup rather than category-level contraction, implying active SKU rotation is steering share toward a few fast-moving Popcorn and 3.5g options.
Top Selling Cannabis Brands






Data for this report comes from real-time sales reporting by participating cannabis retailers via their point-of-sale systems, which are linked up with Headset’s business intelligence software. Headset’s data is very reliable, as it comes digitally direct from our partner retailers. However, the potential does exist for misreporting in the instance of duplicates, incorrectly classified products, inaccurate entry of products into point-of-sale systems, or even simple human error at the point of purchase. Thus, there is a slight margin of error to consider. Brands listed on this page are ranked in the top twenty within the market and product category by total retail sales volume.

