.svg)


Market Insights Snapshot
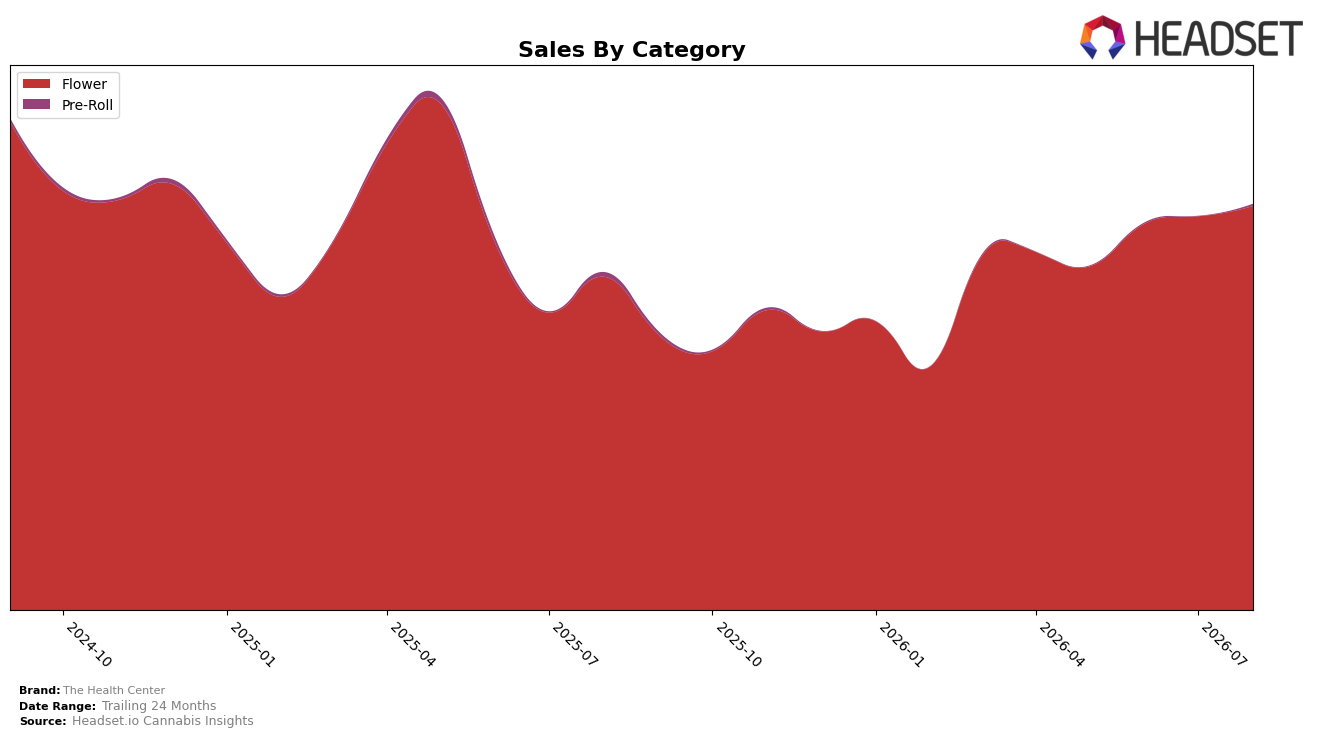
In August 2026, The Health Center concentrated 99.56% category share in Flower while Pre-Roll accounted for 0.44%, signaling an even tighter mix than typical multi-category peers. Flower sales grew 21.28% YoY and 2.62% MoM, while Pre-Roll declined 59.01% YoY from a small base and showed no MoM data, pushing overall YoY brand sales up 20.26% despite a 38.23% two‑year decline. Average price in aggregate inched up 0.05% YoY to $16.89, with Flower pricing at $16.91 and Pre-Roll at $13.22; coupled with Flower’s rank at 25 in Colorado Flower, the mix suggests revenue dependence on a single category with limited price leverage. The pattern implies that August 2026 performance rode category concentration and modest price stability rather than breadth, leaving growth sensitive to Flower momentum and any rank shifts in Colorado.
With Flower at 99.56% share and ranked 25 in Colorado, the 21.28% YoY and 2.62% MoM gains indicate volume-led recovery inside a mid‑tier rank position, while the 59.01% YoY decline in Pre-Roll compresses diversification. The juxtaposition of a 20.26% YoY brand lift against a 38.23% 24‑month decline implies a rebound phase constrained by category narrowness and muted pricing power at 0.05% YoY price change. This configuration implies positioning as a Flower-centric operator where incremental rank improvement within Colorado Flower would have outsized impact, but dependence on one category raises volatility risk if Flower growth or rank 25 placement weakens.
Competitive Landscape
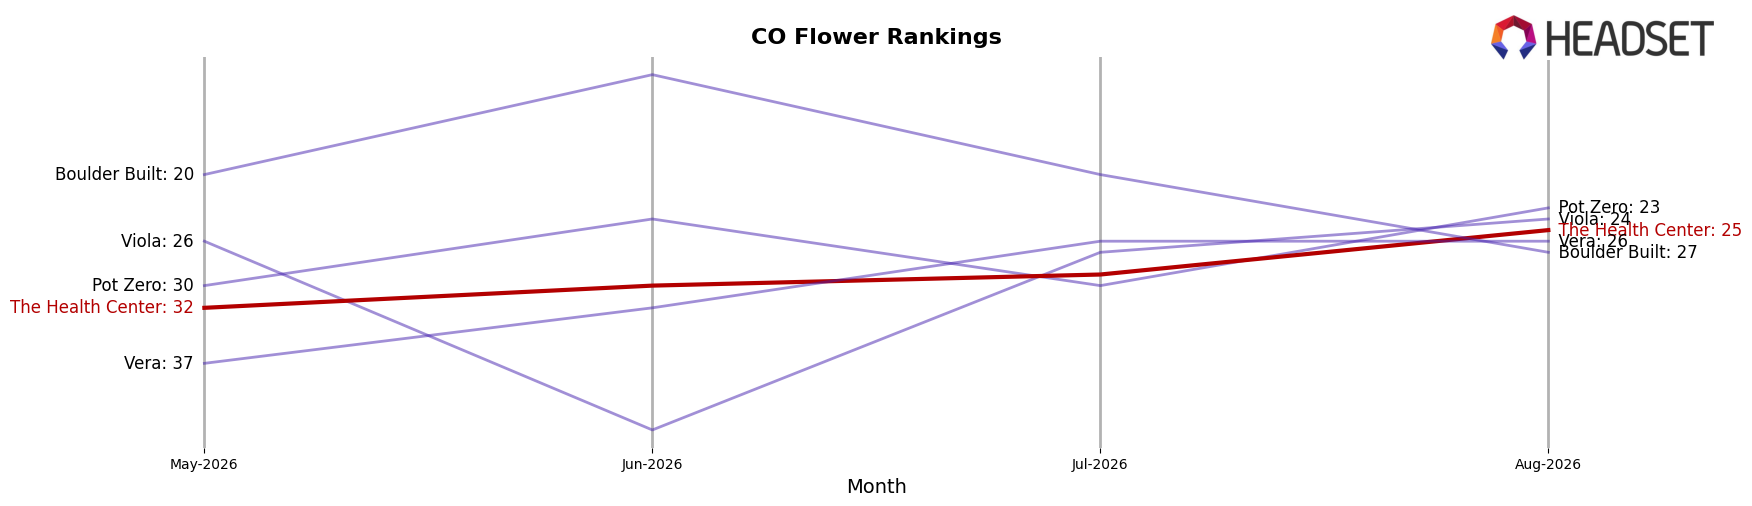
The Health Center sits at rank #25 in Colorado Flower for August 2026, improving 10 positions from #35 year over year, while slipping 7 spots from #32 in May 2026; against that, its historical peak was #13 in August 2024. Competitively, Seed & Strain Cannabis Co. climbed from #2 to #1 as its sales grew 44.8% year over year, and Green Dot Labs advanced from #5 to #3 with 36.5% YoY growth, whereas Good Chemistry Nurseries slipped from #3 to #4 alongside a -3.6% YoY sales change; this mix indicates The Health Center’s YoY rank gain is outpacing some incumbents but not matching the momentum of the fastest risers, implying a stabilization phase where incremental share wins are possible but a return toward its #13 peak will require acceleration beyond competitors posting 18–45% growth.
Notable Products
Honeymoon Diesel Popcorn (7g) delivered the standout move in August 2026 with a 100% month-over-month surge and a climb to rank 1, while MAC Popcorn (7g) advanced 49% and held rank 6, indicating momentum concentrated in value-oriented popcorn formats. Honeymoon Diesel (7g) rose 40% to rank 2 and Strawberry Nightmare (7g) added 11% at rank 4, whereas Strawberry Nightmare Popcorn (7g) inched up just 2% at rank 3, pointing to differentiated velocity between core eighths and their popcorn counterparts within the same strain families. Six of the top ten are Popcorn 7g Flower SKUs, and with only one raw-dollar contribution above $64,000, the mix skews toward high-volume, lower-price packs that are scaling faster than standard 7g offerings. The pattern implies The Health Center is consolidating share through accessible popcorn Flower tiers that pull rank positions upward while anchoring basket value.
Top Selling Cannabis Brands






Data for this report comes from real-time sales reporting by participating cannabis retailers via their point-of-sale systems, which are linked up with Headset’s business intelligence software. Headset’s data is very reliable, as it comes digitally direct from our partner retailers. However, the potential does exist for misreporting in the instance of duplicates, incorrectly classified products, inaccurate entry of products into point-of-sale systems, or even simple human error at the point of purchase. Thus, there is a slight margin of error to consider. Brands listed on this page are ranked in the top twenty within the market and product category by total retail sales volume.

