May-2026
Sales
Trend
6-Month
Product Count
SKUs
Avg Price
YoY Sales Change
YoY Price Change
Market Insights Snapshot
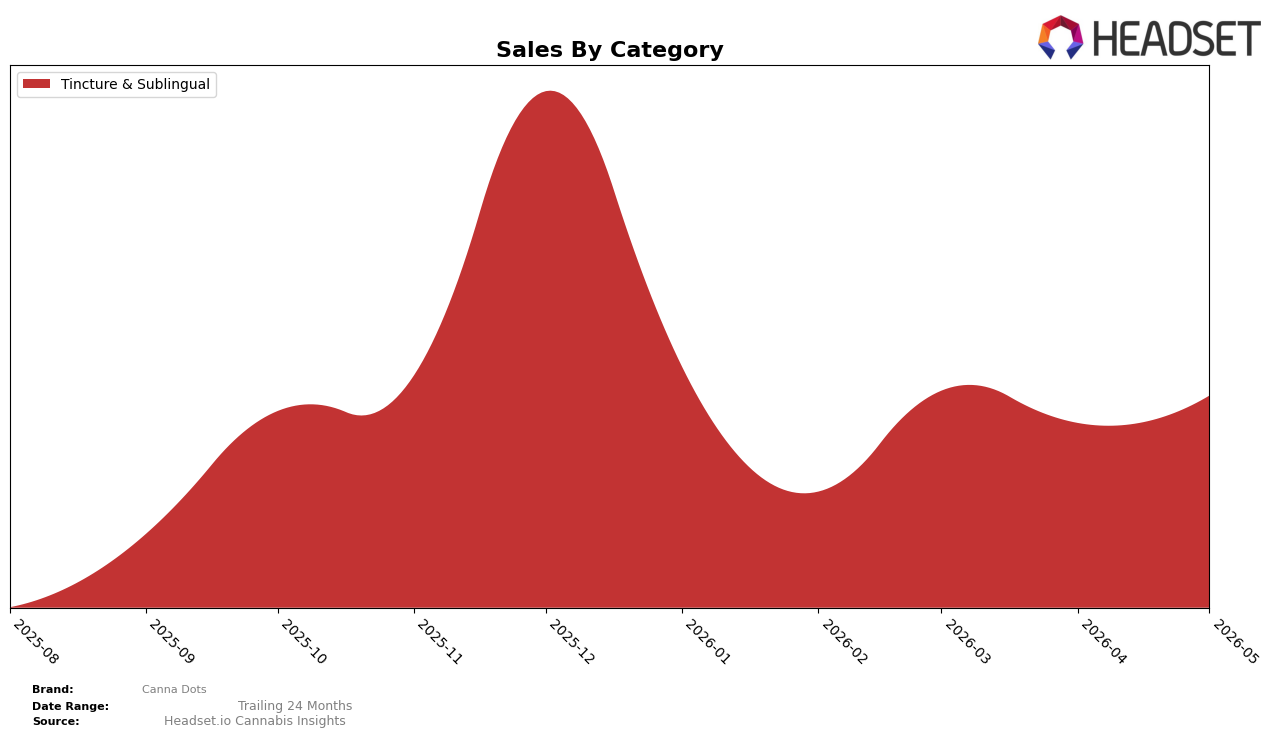
Canna Dots operated as a single-category brand in May 2026, with Tincture & Sublingual holding a 100.0% mix share and posting a 9.25% month-over-month lift, while year-over-year change is not reported and rank data in New York is unavailable. The average price sat at $26.53 alongside the 100.0% category concentration, and the absence of year-over-year metrics paired with a single-category footprint indicates reliance on short-cycle momentum rather than multi-category diversification.
The 9.25% month-over-month increase alongside a 100.0% reliance on Tincture & Sublingual concentrates the brand’s positioning around a single need state, and the lack of reported year-over-year data increases exposure to monthly volatility. With New York as the top market and no published rank to benchmark, the combination of full-category concentration and a single reported monthly gain suggests a tactical focus on depth in one niche instead of breadth across adjacent formats.
Competitive Landscape
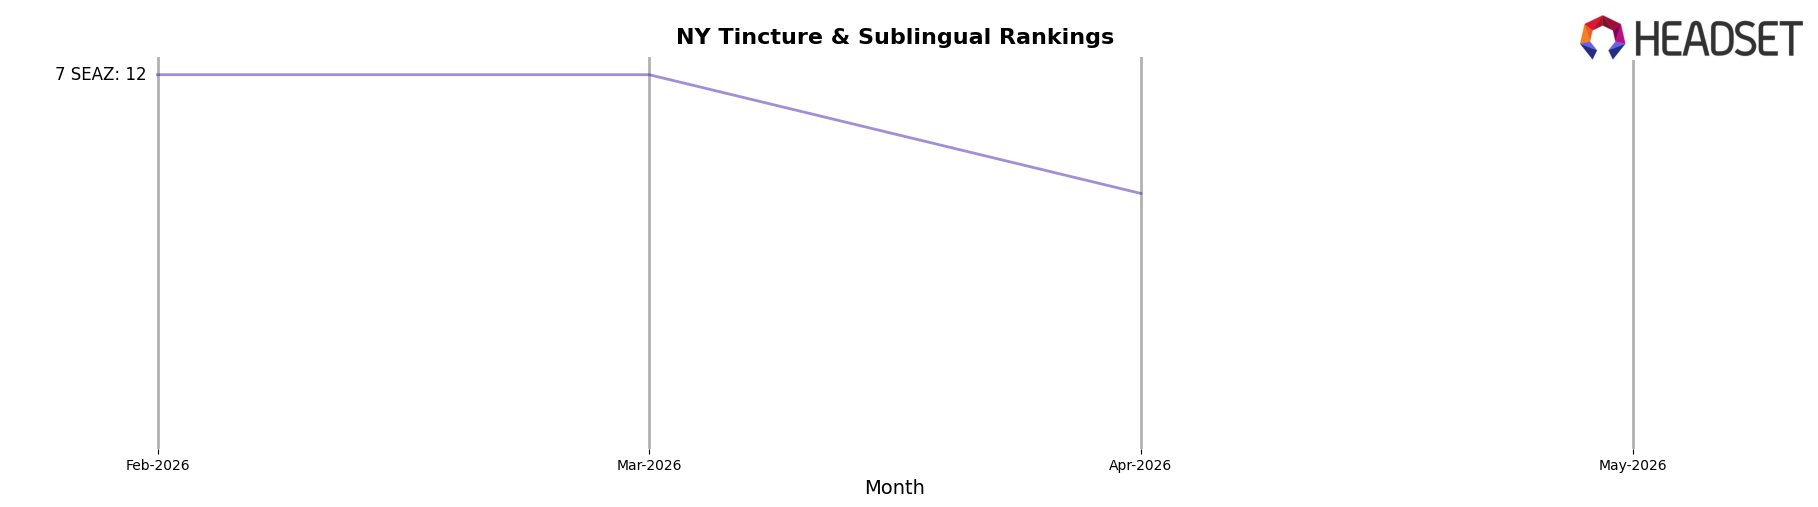
Canna Dots sits at rank #13 in NY Tincture & Sublingual for May 2026, improving 3 positions from #16 in February 2026, while its best spot over the period was #12 in December 2025 and it now trails that peak by 1 rank; year-over-year rank is unavailable, but relative positioning can be inferred against Ayrloom holding #1 with a +22.5% YoY sales change and Mfny (Marijuana Farms New York) sliding from #3 to #4 with a -34.6% YoY sales change. Compared to Head & Heal steady at #2 with a -13.0% YoY sales change and Veterans Choice Creations (VCC) moving from #4 to #3 on +14.0% YoY sales, Canna Dots’ three-month climb from #16 to #13 suggests share is stabilizing just outside the top 10 as leadership concentrates at the top and mid-tier volatility opens a narrow window for incremental rank gains.
Notable Products
Citrus Sublingual Dots 20-Pack (100mg) posted the standout move in May 2026 with a +1202.8% month-over-month surge to $938 and vaulted into rank 5, while Blueberry Sublinguals Dots 20-Pack (100mg) slid -33.7% and sat at rank 3. Unflavored Sublinguals Dots 40-Pack (100mg) grew +44.7% to rank 1 as Cherry Sublinguals Dots 20-Pack (100mg) declined -19.6% at rank 2, and four of the top five SKUs are Tincture & Sublingual formats from the same product family. The pattern implies a pivot toward higher-velocity sublingual formats where a single flavor breakout is reshaping the rank stack and concentrating demand at the top.
Top Selling Cannabis Brands
Data for this report comes from real-time sales reporting by participating cannabis retailers via their point-of-sale systems, which are linked up with Headset’s business intelligence software. Headset’s data is very reliable, as it comes digitally direct from our partner retailers. However, the potential does exist for misreporting in the instance of duplicates, incorrectly classified products, inaccurate entry of products into point-of-sale systems, or even simple human error at the point of purchase. Thus, there is a slight margin of error to consider. Brands listed on this page are ranked in the top twenty within the market and product category by total retail sales volume.

