.svg)

Aug-2026
Sales
Trend
6-Month
Product Count
SKUs
Avg Price
YoY Sales Change
YoY Price Change


Where to Buy
Cantrip is stocked at 21 licensed dispensaries across New Jersey, with the deepest coverage in Andover, Bordentown, Elmwood Park, Evesham, and Flemington. Search by ZIP code or city below to find the closest one.
Market Insights Snapshot
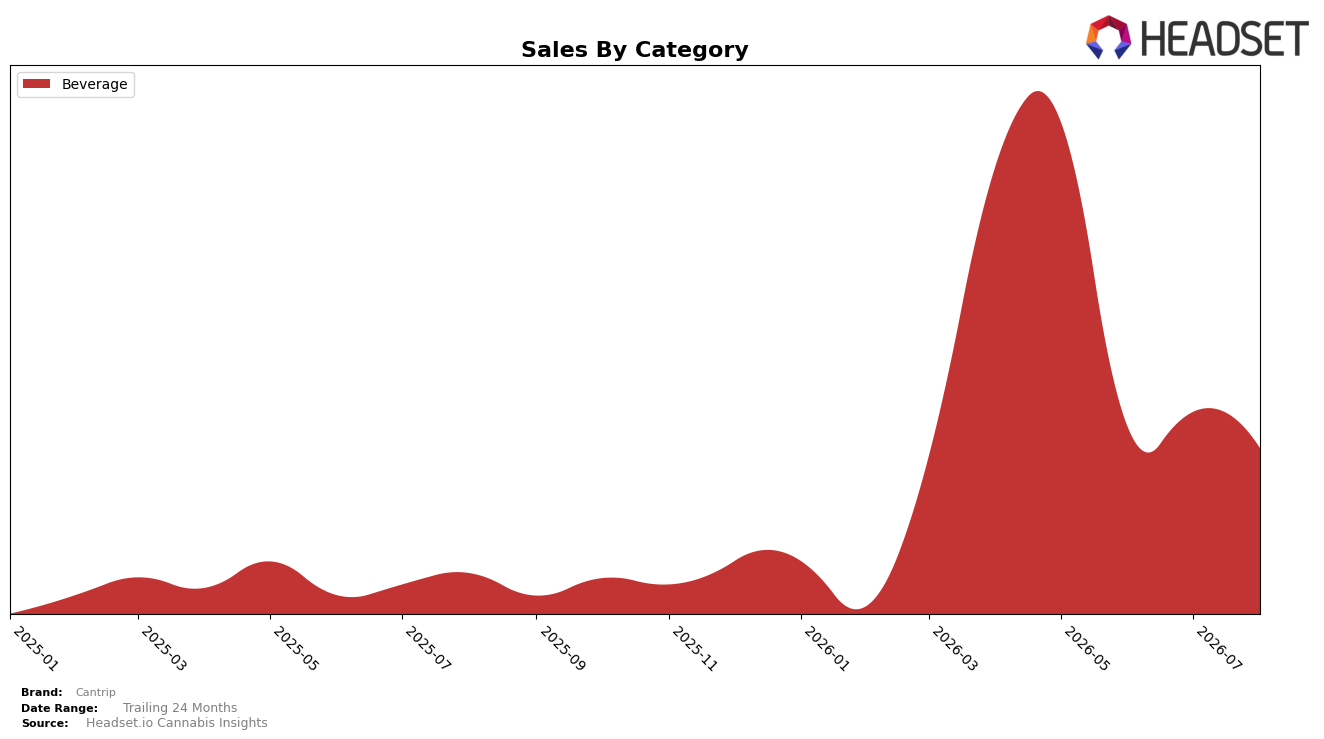
In August 2026, Cantrip’s category mix was entirely concentrated in Beverage, with Beverage holding a 100.0% share and posting a year-over-year change of 300.8% alongside a month-over-month decline of 17.8%. Average price moved up 6.3% YoY to $5.49 while Beverage’s share stayed fixed at 100.0%, indicating volume, not mix, drove the annual surge even as monthly demand softened. The pattern implies a single-category growth engine where August 2026 momentum relied on year-over-year household or account expansion, but near-term pullback suggests sensitivity to seasonal or promotional cadence rather than cross-category cushioning.
Because every dollar came from Beverage at 100.0% share, the 17.8% MoM step-down directly translated to total-brand contraction even as the 300.8% YoY gain sustained headline expansion, and the 6.3% YoY price lift to $5.49 points to limited price elasticity at annual scale but tighter elasticity intra-quarter. With New Jersey as the top market and rank unavailable, the lack of diversification means positioning hinges on maintaining Beverage activation depth rather than breadth, implying Cantrip’s next advantage will come from smoothing monthly volatility within Beverage or introducing a secondary category to buffer future MoM swings.
Competitive Landscape
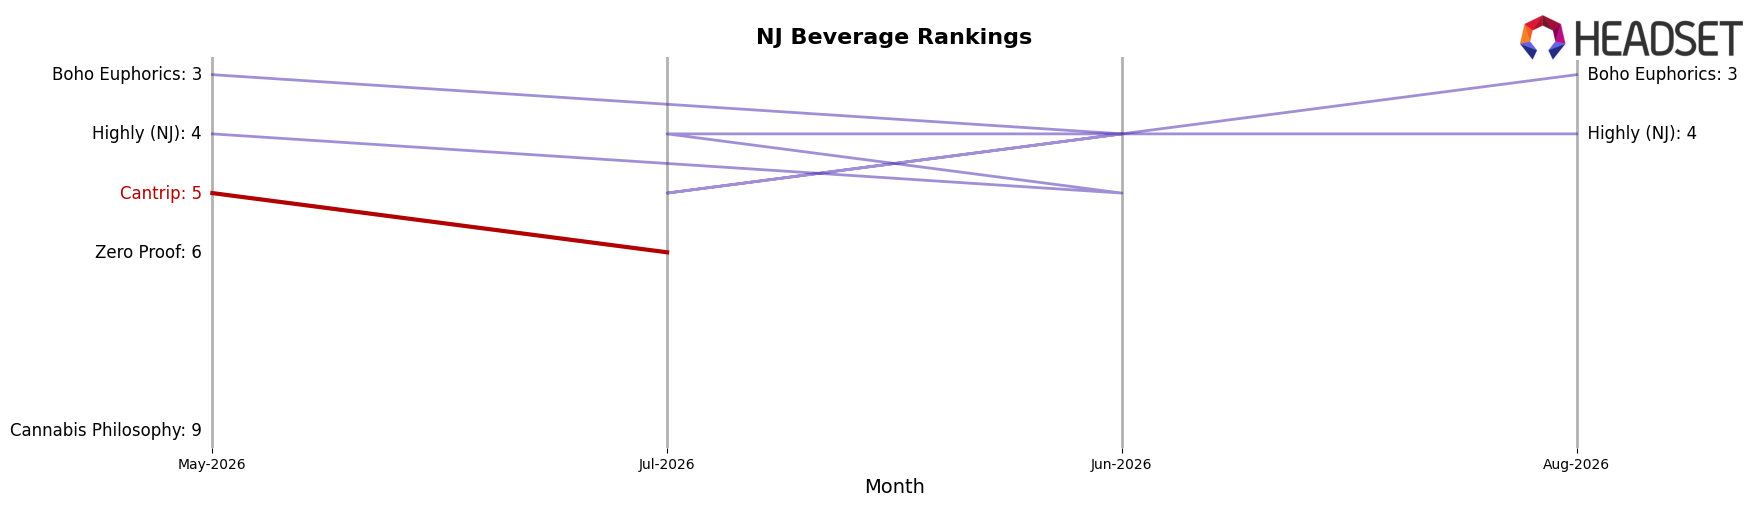
Cantrip sits at #6 in NJ Beverage in August 2026, down 1 rank position from #5 in May 2026, with a 1-place slide over the last three months indicating recent pressure. Meanwhile, Journeyman holds #1 with a 1-position year-over-year rank gain and an 85.1% sales growth, whereas Major is #2 with a 2-position year-over-year hold despite a -54.4% sales decline, and Select edges ahead at #5 while Cantrip trails at #6. The combination of Cantrip’s peak at #5 in May 2026 and current #6 in August 2026, alongside competitors moving up or holding rank despite divergent sales trends, implies Cantrip is at risk of ceding share unless it reverses the month-over-month rank drift.
Notable Products
Grape Soda (10mg THC, 12oz, 355ml) posted the standout surge in August 2026 with +991.7% month over month to rank 2, while Root Beer Soda (10mg THC, 12oz, 355ml) rose +67.6% to hold rank 1 with $2,928 in sales. In contrast, Cola Soda (10mg) fell -44.8% to rank 3 and Dr Cantrip Soda (10mg) declined -15.4% to rank 4, and Diet Cola (10mg) plunged -67.6% to rank 5. With six of the top six SKUs all in Beverage and two flavors occupying ranks 1 and 2 on triple-digit and double-digit gains respectively, the mix implies a pivot toward flavor-led 10mg sodas where a few winners absorb share as legacy cola profiles retreat.
Top Selling Cannabis Brands






Data for this report comes from real-time sales reporting by participating cannabis retailers via their point-of-sale systems, which are linked up with Headset’s business intelligence software. Headset’s data is very reliable, as it comes digitally direct from our partner retailers. However, the potential does exist for misreporting in the instance of duplicates, incorrectly classified products, inaccurate entry of products into point-of-sale systems, or even simple human error at the point of purchase. Thus, there is a slight margin of error to consider. Brands listed on this page are ranked in the top twenty within the market and product category by total retail sales volume.

