.svg)

Sep-2026
Sales
Trend
6-Month
Product Count
SKUs
Avg Price
YoY Sales Change
YoY Price Change


Where to Buy
Bubby's Baked is stocked at 247 licensed dispensaries across Massachusetts, Illinois, and 2 other states, 96 of them in Massachusetts, with the deepest coverage in Boston, Springfield, Worcester, Dracut, and Pittsfield. Search by ZIP code or city below to find the closest one.
Market Insights Snapshot
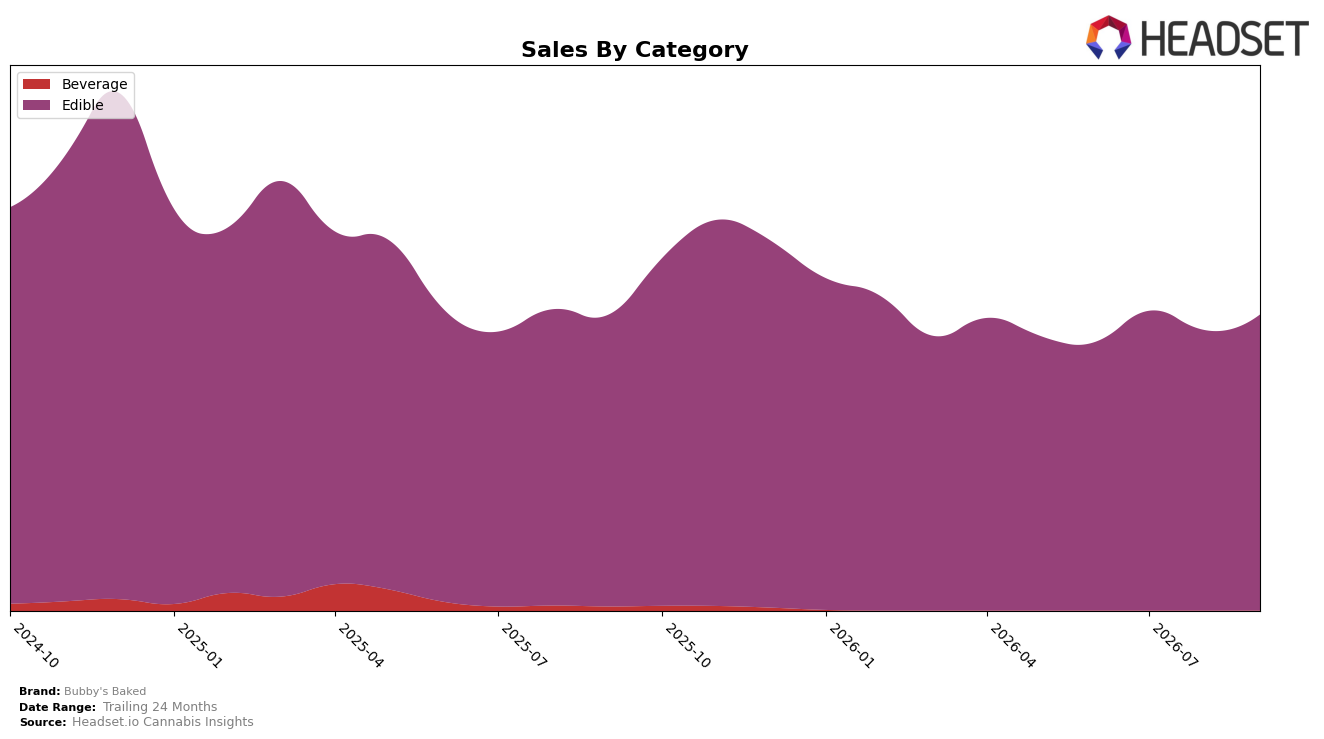
In September 2026, Bubby's Baked operated as a single-category brand, with Edible accounting for 100.0% of sales and a month-over-month gain of 5.55% alongside a year-over-year increase of 1.49%. Average price rose 2.47% year over year to $15.06, while brand-level sales advanced 8.29% year over year but trailed the 24-month trend of -12.17%. Within Maryland Edibles, the brand held rank 24, and the combination of a 5.55% MoM lift and rank 24 positioning implies the recent uptick is volume-led within a narrow focus rather than a broad portfolio expansion.
The consolidation into Edibles at 100.0% share, paired with a 1.49% YoY sales gain against a 2.47% YoY price increase, indicates limited mix-driven premiumization; the 5.55% MoM growth suggests tactical wins in September 2026 rather than structural price-led growth. Holding rank 24 in Maryland Edibles while brand sales rose 8.29% YoY, yet lagging on a -12.17% 24-month basis, implies a mid-pack positioning where near-term momentum must translate into sustained velocity improvements to close a multi-year share gap.
Competitive Landscape
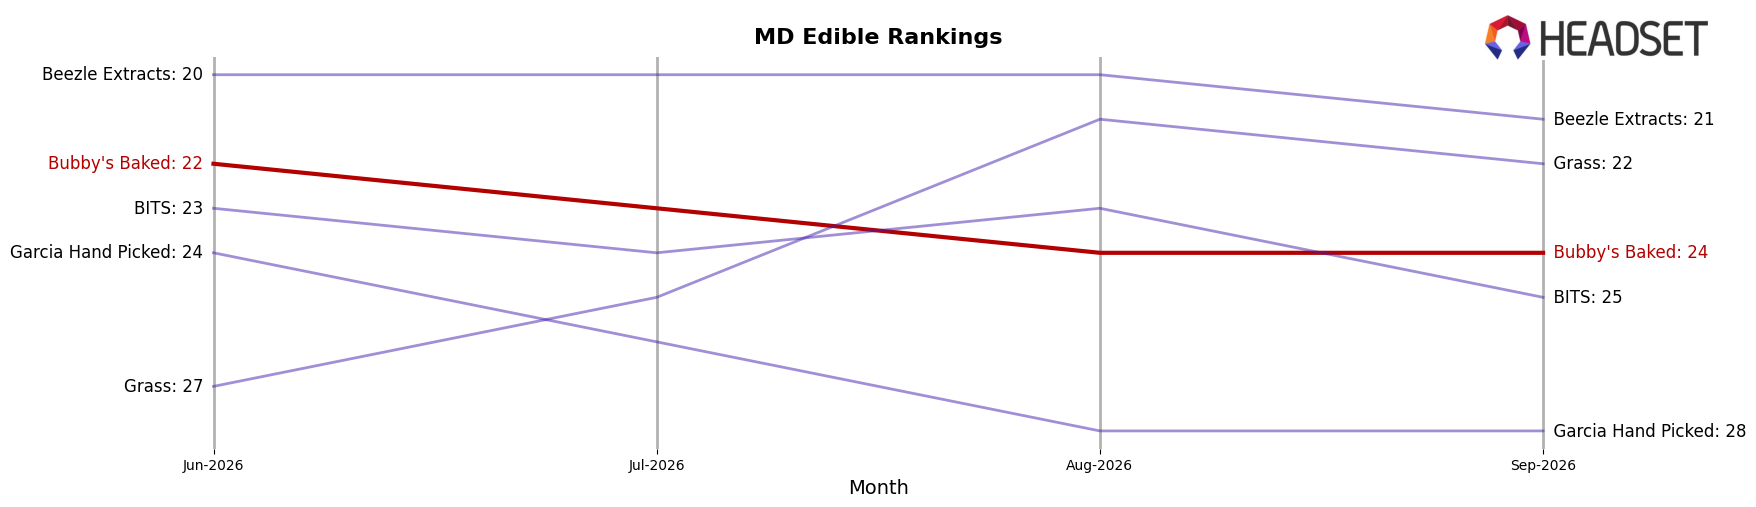
Bubby's Baked sits at rank #24 in MD Edible for September 2026, down 2 positions year over year from #22 and also 2 spots below its 3-month mark of #22; against its peak at #19 in November 2024, the current placement is 5 ranks lower, indicating a multi-quarter slide rather than a single-month dip. Meanwhile, Incredibles climbed from #5 to #1 with a 58.1% YoY sales change, while Betty's Eddies held at #2 despite a -7.3% YoY shift, signaling that upward mobility is occurring at the very top as mid-pack brands like Bubby's Baked cede ground. The pattern implies Bubby's Baked is drifting from prior peak positioning as leaders consolidate share, so absent a rank rebound from #24 toward the low-20s, the brand risks entrenchment outside the top 20.
Notable Products
Birthday Cake Full Spectrum Bites 5-Pack (50mg) delivered the standout move in September 2026 with a +71.8% month-over-month surge that vaulted it to rank 1, while Birthday Cake Full Spectrum Bites 5-Pack (100mg) fell -28.2% to rank 4. Brownie Full Spectrum Bites 10-Pack (100mg) rose +33.5% at rank 2, creating a split where lower-dose Birthday Cake gained share as the higher-dose variant ceded it. With all top-10 items in the Edible category and at least four of the top ten concentrated in Birthday Cake and Brownie families, the mix points to dose-size and flavor lineage driving trade-ups and cannibalization rather than category expansion, implying a near-term focus on optimizing Birthday Cake pack-size architecture over launching new forms.
Top Selling Cannabis Brands






Data for this report comes from real-time sales reporting by participating cannabis retailers via their point-of-sale systems, which are linked up with Headset’s business intelligence software. Headset’s data is very reliable, as it comes digitally direct from our partner retailers. However, the potential does exist for misreporting in the instance of duplicates, incorrectly classified products, inaccurate entry of products into point-of-sale systems, or even simple human error at the point of purchase. Thus, there is a slight margin of error to consider. Brands listed on this page are ranked in the top twenty within the market and product category by total retail sales volume.

