Jun-2026
Sales
Trend
6-Month
Product Count
SKUs
Avg Price
YoY Sales Change
YoY Price Change
Market Insights Snapshot
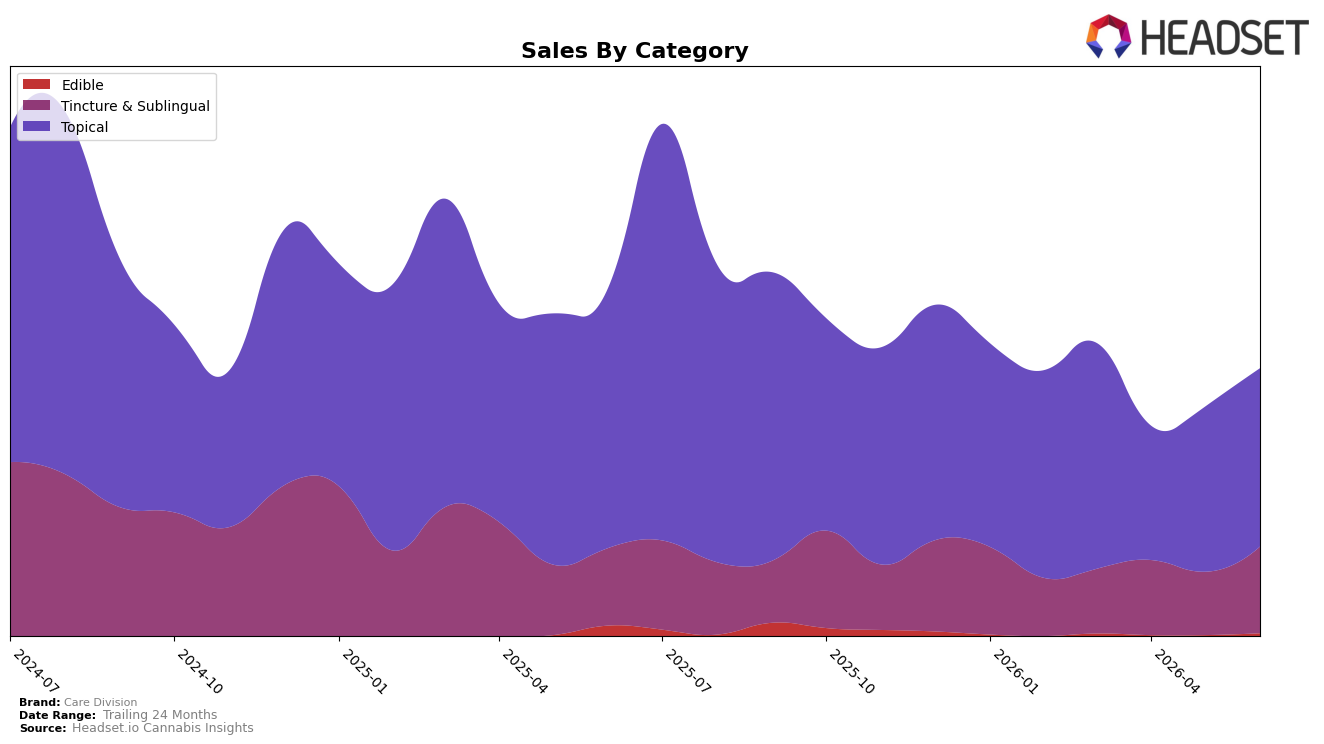
Care Division’s category mix in June 2026 concentrated 66.65% of sales in Topical, where year-over-year sales declined 31.54% but month-over-month grew 8.27%, while Tincture & Sublingual rose to 32.30% share with year-over-year growth of 11.82% and a month-over-month surge of 37.01%. Edible remained a small 1.05% share with a 73.31% year-over-year decline despite a 196.63% month-over-month rebound, and the brand’s average price slipped 0.22% year-over-year to $45.40. With an overall brand sales decline of 23.17% year-over-year and a two-year decline of 15.21%, the mix shift suggests a partial offset from faster-growing Tincture & Sublingual against pressure in Topical, implying reliance on June’s month-over-month gains to stabilize volumes in Colorado where Care Division holds rank 4 in Topical.
The combination of a 31.54% Topical year-over-year contraction alongside a 11.82% Tincture & Sublingual year-over-year increase indicates the brand is migrating demand toward formats with lower average prices (Topical $52.96 vs. Tincture & Sublingual $35.30), while preserving premium positioning within Topical via a category-leading price point and rank 4 status. The 37.01% month-over-month lift in Tincture & Sublingual, paired with an 8.27% Topical month-over-month rise, points to near-term cross-format trial rather than pure cannibalization, implying that sustained promotion of Tincture & Sublingual can cushion Topical volatility and that selective price discipline (average price down 0.22% year-over-year) can maintain share without eroding perceived quality in Colorado.
Competitive Landscape
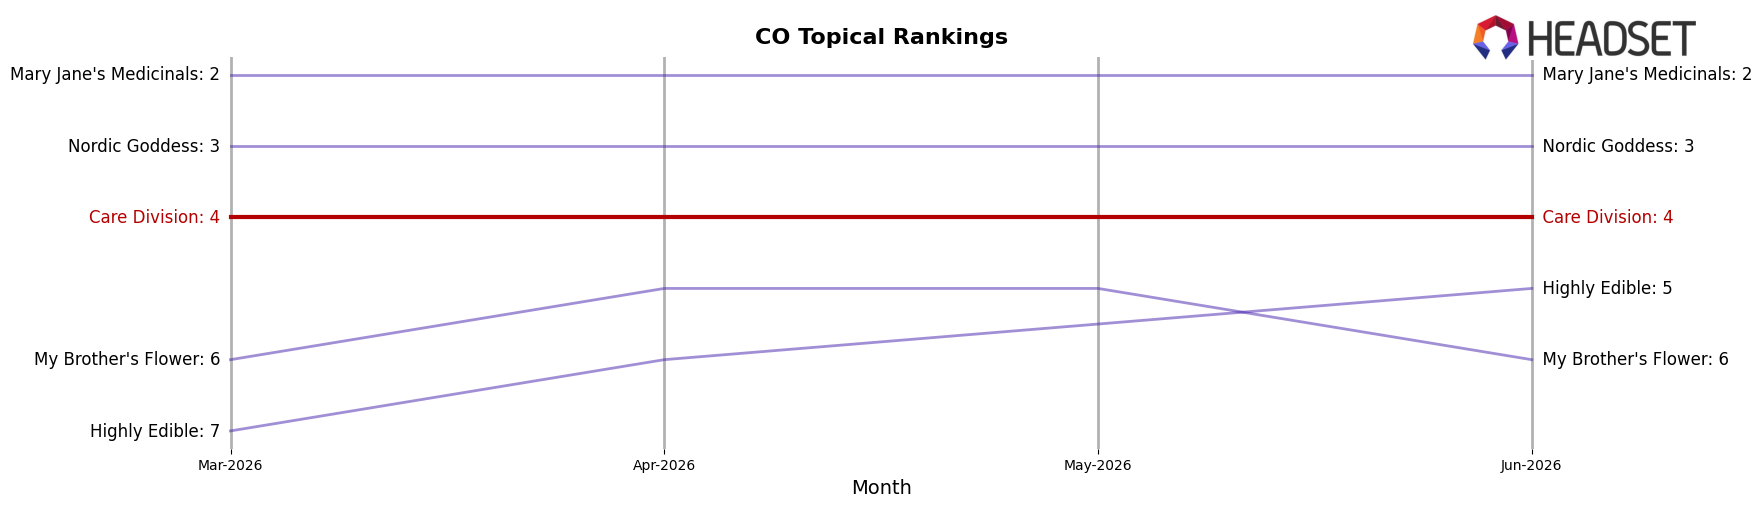
Care Division sits at #4 in CO Topical in June 2026, up 1 rank from #5 year over year, and unchanged from #4 three months ago, indicating a climb followed by a plateau; in contrast, Escape Artists held #1 with a 4.29% YoY sales increase while Nordic Goddess moved from #4 to #3 despite a -32.15% YoY sales decline, and Mary Jane's Medicinals improved from #3 to #2 alongside a -4.15% YoY sales change; together, these rank shifts and mixed sales trajectories imply that Care Division’s incremental rise to its peak rank of #4 in June 2026 positions it to capture share if it converts stability into upward mobility against competitors showing either flat leadership or rank gains despite negative YoY trends.
Notable Products
CBD/THC 10:1 Mend Tincture (1000mg CBD, 100mg THC) delivered the standout move in June 2026 with a 218% month-over-month surge to rank 3, while CBD/THC 10:1 Chill Tincture (1000mg CBD, 100mg THC) rose 93% to rank 2. Against this upswing in tinctures, CBD/THC 1:1 Soothe Pain Relief Salve (250mg CBD, 250mg THC, 2oz) fell 42% to rank 6 and the CBD Paws & Tails Pet Tincture (750mg CBD) declined 18% to rank 5, indicating a reallocation of buyer interest within the portfolio. Four of the top ten are Tincture & Sublingual SKUs, and CBD/THC 1:1 The Truth Pain Relief Cream (2000mg CBD, 2000mg THC, 2oz) still held rank 1 with 27% growth and $34,503 in sales, while the category bench beyond the leader is redistributing share toward higher CBD-dominant ratios. The emerging pattern implies Care Division is consolidating around multi-ratio wellness tinctures that can scale rank quickly, using the flagship topical’s stable base as a traffic anchor.
Top Selling Cannabis Brands
Data for this report comes from real-time sales reporting by participating cannabis retailers via their point-of-sale systems, which are linked up with Headset’s business intelligence software. Headset’s data is very reliable, as it comes digitally direct from our partner retailers. However, the potential does exist for misreporting in the instance of duplicates, incorrectly classified products, inaccurate entry of products into point-of-sale systems, or even simple human error at the point of purchase. Thus, there is a slight margin of error to consider. Brands listed on this page are ranked in the top twenty within the market and product category by total retail sales volume.

