.svg)

Sep-2026
Sales
Trend
6-Month
Product Count
SKUs
Avg Price
YoY Sales Change
YoY Price Change


Where to Buy
Nordic Goddess is stocked at 42 licensed dispensaries across Colorado and Nevada, 36 of them in Colorado, with the deepest coverage in Denver, Pagosa Springs, Boulder, Fort Collins, and Golden. Search by ZIP code or city below to find the closest one.
Market Insights Snapshot
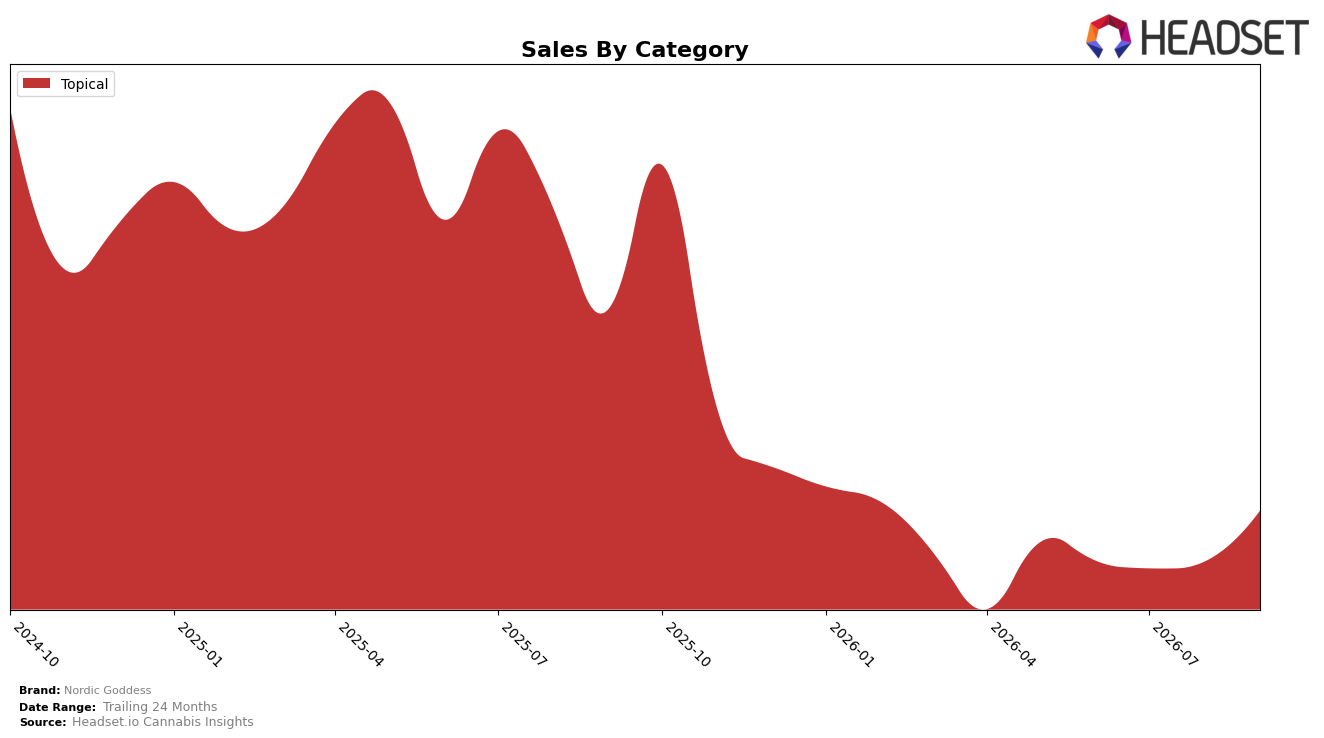
In September 2026, Nordic Goddess operated as a single-category brand, with Topical accounting for 100.0% of sales share and a month-over-month change of 32.82% alongside a year-over-year decline of 49.41%. Average price rose 33.15% year over year while category sales fell 49.41%, creating a mix where higher unit pricing coincided with fewer units sold. This pattern implies a pivot toward premium-priced Topicals that lifted September 2026 revenue versus August 2026 by 32.82% while shrinking the annual base by 49.41%, concentrating risk in one category and one price tier.
Positioning now depends on sustaining the September 2026 momentum in Topicals while mitigating exposure to a single segment, given a 49.41% year-over-year drop against a 32.82% month-over-month rebound. With an average price at $59.53 and up 33.15% year over year, the brand sits higher on the price ladder as it holds rank 3 in Topical in Colorado; this rank placement paired with a 100.0% category share suggests differentiation via price and format rather than breadth. The implication is that Nordic Goddess must either defend a top-3 Topical niche in Colorado against potential price elasticity effects or diversify its mix to reduce the probability of further annual contraction despite short-term monthly gains.
Competitive Landscape
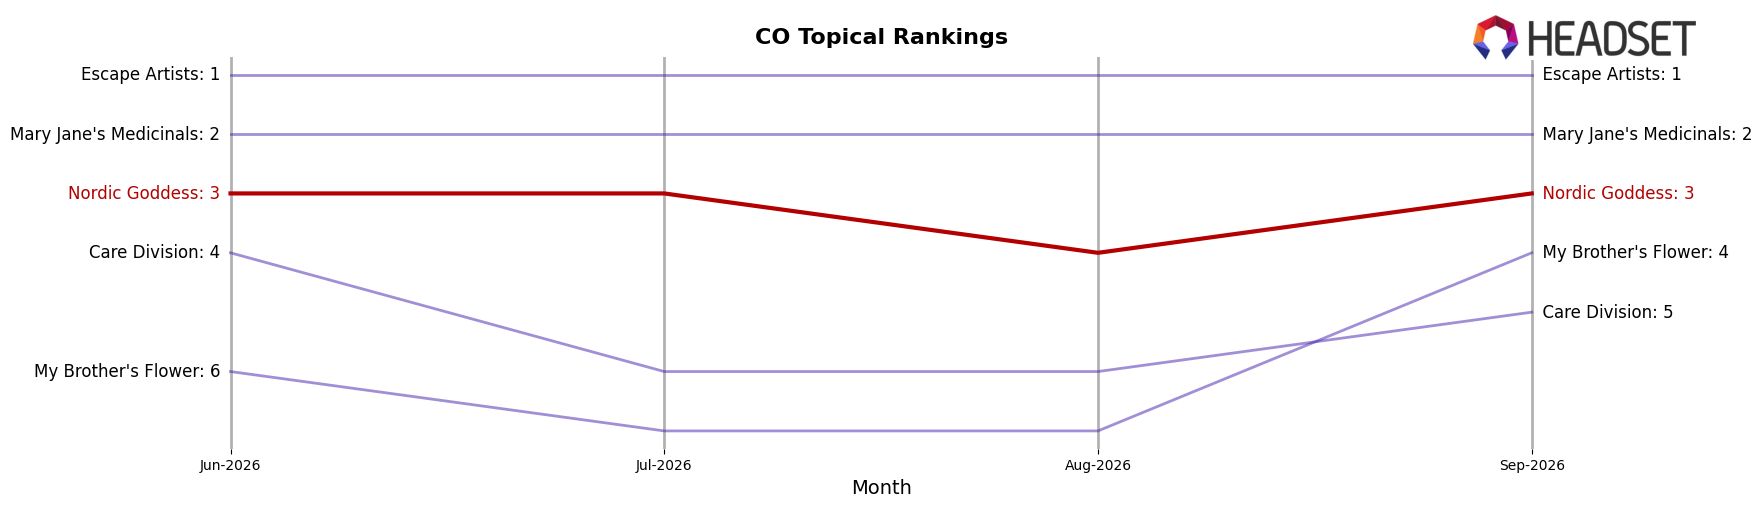
Nordic Goddess sits at rank #3 in CO Topical in September 2026, unchanged YoY from #3, and also unchanged over the last three months at #3; this stability contrasts with Escape Artists holding #1 with a -1.27% YoY sales change and Mary Jane's Medicinals holding #2 with a -4.26% YoY decline, while My Brother's Flower rose from #5 to #4 as Care Division slipped from #4 to #5 with a -54.90% YoY change; the pattern implies Nordic Goddess is locked in a stable third position despite competitive churn above and below, signaling a plateau that will require share capture from either #2 or #1 to alter trajectory.
Notable Products
Wrangler Body Balm (2oz) delivered the standout movement in September 2026 with a 2426% month-over-month surge to rank 3, while the CBD/THC 1:1 Peppermint Body Balm (250mg CBD/250mg THC, 2oz) also cleared the 50% threshold with a 104% gain at rank 5. At the top, CBD/THC/CBG 10:10:1 Vibe 10X Body Balm (2500mg CBD, 2500mg THC, 250mg CBG 2oz) rose 67% to rank 1, contrasting with Body Balm (250mg) dropping 42% at rank 4 and CBD/THC 1:1 Vibe 10x Body Balm (2500mg CBD, 2500mg THC, 2oz) falling 75% at rank 6. With all top-10 placements concentrated in the Topical category and one SKU accounting for $38,311, the mix points to Nordic Goddess leaning into high-potency topical formats while pruning or restructuring legacy lower-dose balms.
Top Selling Cannabis Brands






Data for this report comes from real-time sales reporting by participating cannabis retailers via their point-of-sale systems, which are linked up with Headset’s business intelligence software. Headset’s data is very reliable, as it comes digitally direct from our partner retailers. However, the potential does exist for misreporting in the instance of duplicates, incorrectly classified products, inaccurate entry of products into point-of-sale systems, or even simple human error at the point of purchase. Thus, there is a slight margin of error to consider. Brands listed on this page are ranked in the top twenty within the market and product category by total retail sales volume.

