Jun-2026
Sales
Trend
6-Month
Product Count
SKUs
Avg Price
YoY Sales Change
YoY Price Change
Market Insights Snapshot
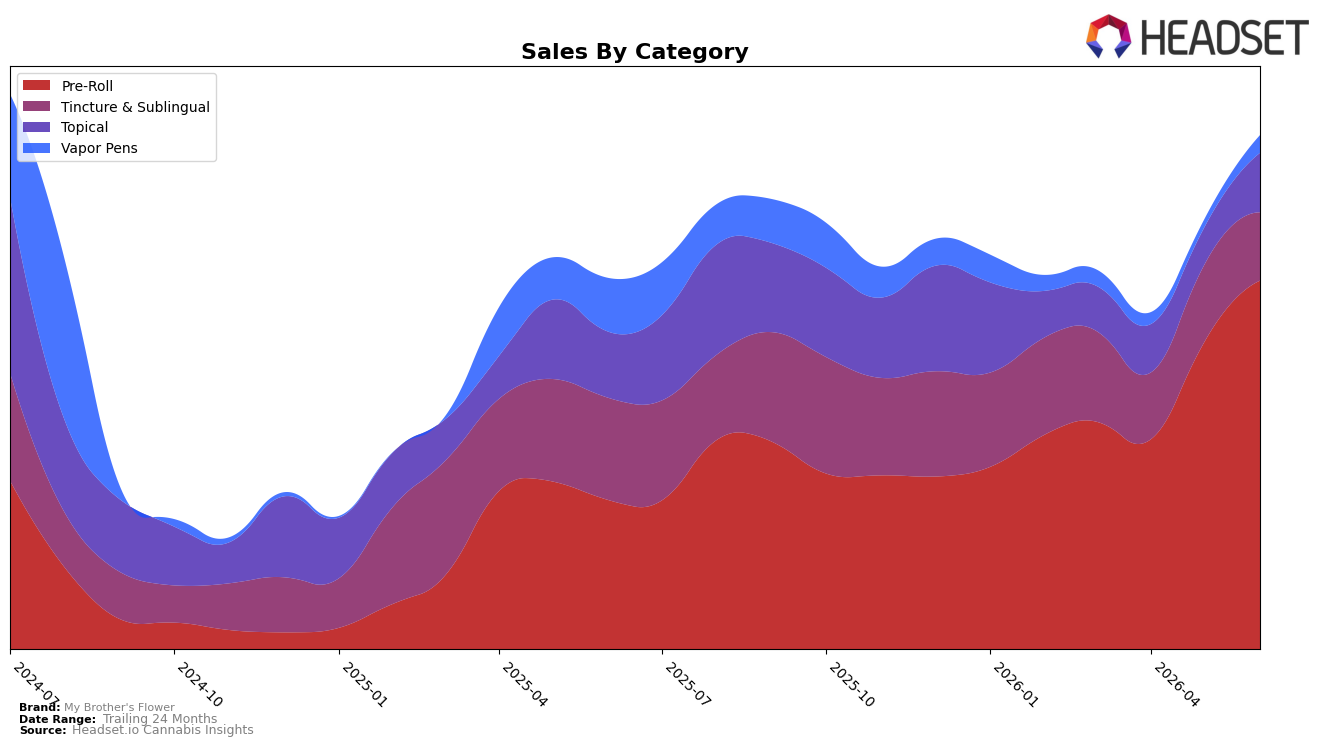
My Brother's Flower concentrated in Pre-Roll during June 2026, with share at 71.73% and category sales up 147.03% year over year while rising 19.79% month over month; in contrast, Tincture & Sublingual held 13.28% share but declined 33.18% YoY and 11.64% MoM. Topical accounted for 11.55% share with a 59.05% MoM surge despite a 10.11% YoY dip, and Vapor Pens sat at 3.44% share after a 118.34% MoM rebound against a 67.09% YoY drop. Average price fell 28.54% YoY to $15.99 as Pre-Roll pricing sat at $13.39 versus $29.80 in Tincture & Sublingual, implying mix-driven price compression. The pattern implies deliberate pivot toward value-leaning Pre-Roll volume, trading YoY declines in Tincture & Sublingual for scale where momentum is compounding.
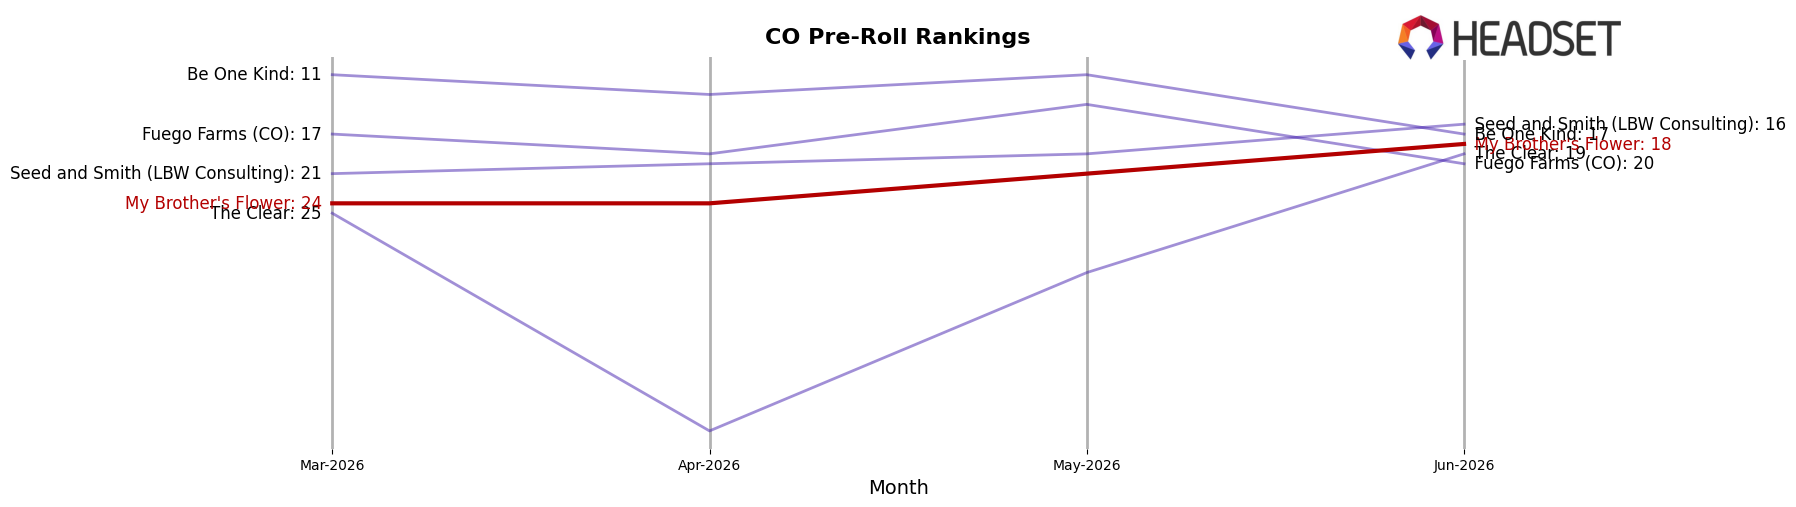
With Pre-Roll at 71.73% share and a 19.79% MoM gain, the brand’s June 2026 mix suggests prioritization of repeatable, lower-priced units to fuel 38.50% YoY brand sales growth while accepting a 28.54% YoY average price decline. The 59.05% MoM lift in Topical alongside an 11.55% share positions it as a secondary stabilizer, whereas the 118.34% MoM uptick in Vapor Pens from a 3.44% base frames it as optionality rather than a core pillar. Holding rank 18 in Pre-Roll within Colorado implies room to climb if the brand sustains Pre-Roll mix and moderates price erosion, so the strategic posture is scale-first in Pre-Roll with Topical as a hedge and limited near-term reliance on Tincture & Sublingual.
Competitive Landscape
My Brother's Flower sits at rank #18 in Colorado Pre-Roll in June 2026, up 17 positions from #35 year over year, and 6 spots higher than March 2026’s #24, marking its peak position to date at #18 in June 2026; meanwhile, Green Dot Labs rose from #2 to #1 with 48.4% year-over-year sales growth, and Cali-Blaze slipped from #1 to #2 amid a 2.3% sales decline, indicating that My Brother's Flower is moving from the long tail toward the top tier but still trails leaders that are consolidating share at the very top.
Notable Products
Dusk Infused Pre-Roll (1.5g) posted the steepest decline in June 2026 at -32.4% MoM while slipping to rank 5, and CBD/CBN/THC 10:10:1 Dusk Tincture (1000mg CBD, 1000mg CBN, 100mg THC) fell -31.8% MoM at rank 8; by contrast, Pineapple Express Infused Pre-Roll (1.5g) rose 43.9% MoM to rank 2 and Blueberry Kush Infused Pre-Roll (1.5g) climbed 34.0% MoM to hold rank 1. Six of the top ten are Pre-Roll SKUs clustered at ranks 1 through 6, while Tincture & Sublingual items occupy ranks 7, 8, and 10 with mixed momentum including +24.7% MoM for CBD/THC 25:1 Extra Strength Rosin Raw Tincture (2500mg CBD, 100mg THC). The split between accelerating flagship Pre-Rolls and contracting Dusk-labeled formats implies the brand’s near-term revenue will lean into high-THC infused Pre-Rolls while rethinking evening-positioned SKUs and tincture pacing.
Top Selling Cannabis Brands
Data for this report comes from real-time sales reporting by participating cannabis retailers via their point-of-sale systems, which are linked up with Headset’s business intelligence software. Headset’s data is very reliable, as it comes digitally direct from our partner retailers. However, the potential does exist for misreporting in the instance of duplicates, incorrectly classified products, inaccurate entry of products into point-of-sale systems, or even simple human error at the point of purchase. Thus, there is a slight margin of error to consider. Brands listed on this page are ranked in the top twenty within the market and product category by total retail sales volume.

