Jun-2026
Sales
Trend
6-Month
Product Count
SKUs
Avg Price
YoY Sales Change
YoY Price Change
Market Insights Snapshot
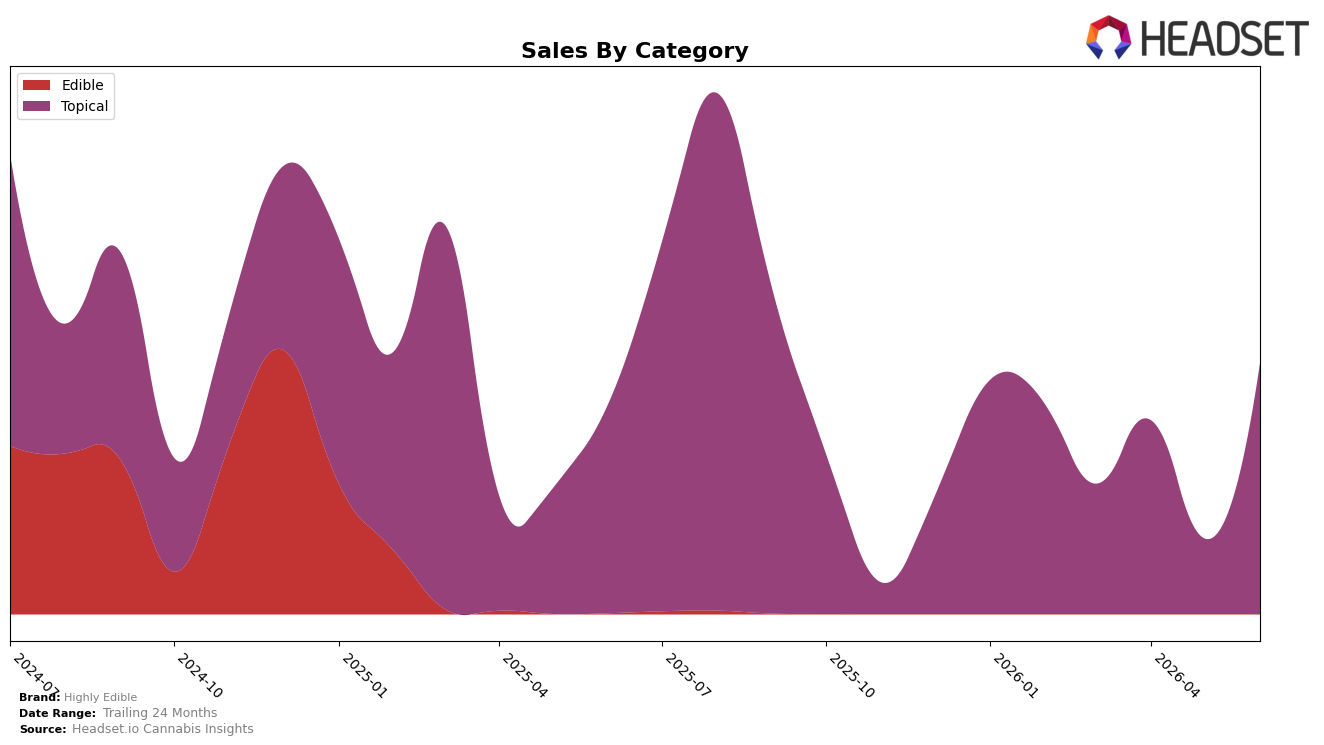
In June 2026, Highly Edible operated as a single-category brand with Topical accounting for 100.0% of sales, concentrating all mix exposure in one segment. Within Topical, year-over-year sales rose 19.9% while month-over-month spiked 234.1%, alongside a 5.7% YoY increase in average price and a current average price of $68.01, indicating that volume, not just pricing, drove the monthly step-change. With overall brand sales up 19.5% YoY but down 38.0% over 24 months, the June surge in a 100.0% Topical mix implies a narrow but intensifying bet on a single demand pocket rather than diversified growth.
The shift concentrates positioning in Colorado’s Topical set where the brand holds rank 5, making gains depend on sustaining category-specific momentum rather than cross-category insulation. The 234.1% MoM rise against a 19.9% YoY climb suggests a recent activation or distribution effect that may be transient unless converted into share, while the 5.7% YoY price lift at a $68.01 average price limits pure price-driven upside. The pattern implies Highly Edible’s near-term strategy is to defend and advance within a mid-tier rank in Topical through volume-led expansion, accepting exposure to category cyclicality over diversification.
Competitive Landscape
Highly Edible sits at rank #5 in Colorado Topical for June 2026, improving 2 positions year over year from #7 while holding flat versus March 2026 at #7 before the recent climb; the brand’s best historical mark remains #4 in August 2025, indicating proximity but not re-attainment of peak. Competitive context tightened as Escape Artists held #1 year over year with a 4.3% sales gain while Mary Jane's Medicinals moved up from #3 to #2 despite a 4.1% sales decline, and Nordic Goddess rose from #4 to #3 even as sales fell 32.2%, contrasting with Care Division advancing from #5 to #4 alongside a 31.5% sales drop; this mix of upward rank mobility despite negative sales comps suggests Highly Edible’s 2-rank YoY gain reflects share capture from contracting peers, implying a window to reclaim #4 if it converts stability into incremental velocity.

Notable Products
CBD/THC 1:1 Nordic Goddess Body Balm (250 CBD, 250 THC, 2oz ) posted the standout movement for June 2026 with a +234% month-over-month surge and a jump to rank 1, concentrating Highly Edible’s Topical presence at the top of the chart. With only one SKU in the top tier and no other categories represented among the leaders, the portfolio’s rank profile is narrow despite the outsized percentage gain, indicating dependence on a single Topical winner. The month’s sales mix is anchored by one product that converted momentum into category leadership, while the absence of other ranked SKUs signals a fragile breadth-to-depth tradeoff around a single hero. This pattern implies Highly Edible is tilting toward a focused play in Topicals, prioritizing depth in a flagship SKU over wider category diversification.
Top Selling Cannabis Brands
Data for this report comes from real-time sales reporting by participating cannabis retailers via their point-of-sale systems, which are linked up with Headset’s business intelligence software. Headset’s data is very reliable, as it comes digitally direct from our partner retailers. However, the potential does exist for misreporting in the instance of duplicates, incorrectly classified products, inaccurate entry of products into point-of-sale systems, or even simple human error at the point of purchase. Thus, there is a slight margin of error to consider. Brands listed on this page are ranked in the top twenty within the market and product category by total retail sales volume.

