Jun-2026
Sales
Trend
6-Month
Product Count
SKUs
Avg Price
YoY Sales Change
YoY Price Change
Market Insights Snapshot
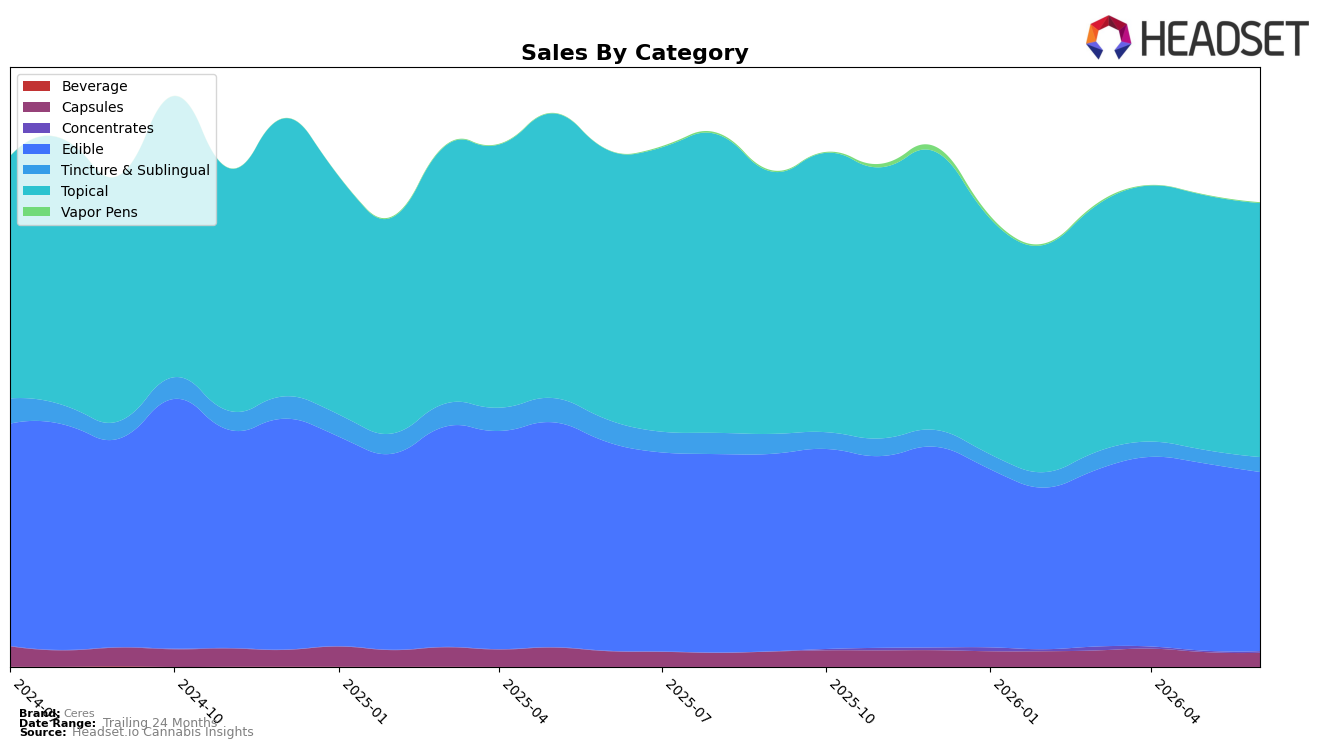
In June 2026, Ceres concentrated 54.79% of sales in Topical with year-over-year down 5.83% and month-over-month down 0.32%, while Edible held 38.62% share with a 14.11% YoY decline and a 4.39% MoM decline. Smaller lines moved unevenly: Tincture & Sublingual at 3.17% share fell 33.86% YoY but rose 11.00% MoM, Capsules at 2.99% share slipped 10.24% YoY and 4.83% MoM, Concentrates surged 949.72% YoY and 24.21% MoM to 0.30% share, and Vapor Pens jumped 599.77% YoY and 51.12% MoM to 0.13% share. With total brand sales down 10.17% YoY and average price up 1.92% YoY to $16.16, the pattern implies reliance on a contracting Topical and Edible base while nascent gains in Concentrates and Vapor Pens are too small in share to offset declines yet.
The mix points to Ceres anchoring around Topical leadership (rank 1 in Topical in Washington) but absorbing broader demand softness as Edible retreats faster than Topical and high-growth niches remain sub‑1% each. The near-term opportunity is to translate the 11.00% MoM lift in Tincture & Sublingual and the 24.21%–51.12% MoM bursts in Concentrates and Vapor Pens into sustained share gains, because maintaining a 54.79%–38.62% split between Topical and Edible under current YoY declines biases the portfolio toward continued overall contraction.
Competitive Landscape
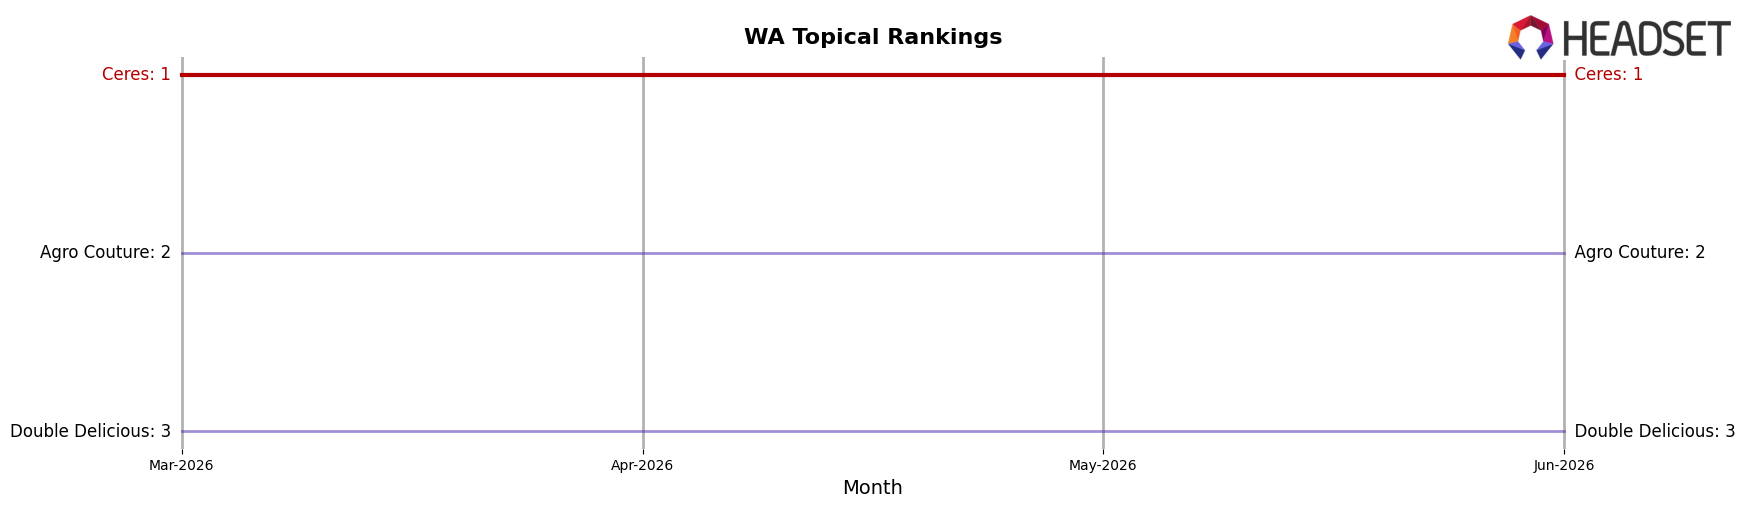
Ceres holds rank #1 in WA Topical in June 2026 with no year-over-year rank change from #1, and it also held #1 three months ago, indicating zero movement at the top while peers shuffled positions. Agro Couture sits at #2 after improving from #3 year over year with sales up 6.54%, while Double Delicious declined from #2 to #3 alongside a 26.99% sales drop; additionally, Fairwinds stayed at #4 with sales down 29.31% as SnacMe rose from #6 to #5 with 54.47% growth. The contrast between competitors’ rank gains and double-digit sales swings versus Ceres’ stable #1 position implies entrenched category leadership that is resilient to both upward and downward volatility among followers.
Notable Products
The steepest setback in June 2026 came from Sativa Sea Salted Caramel Chocolate Balls 10-Pack (100mg), which fell 16.3% MoM to rank 4 while CBD/THC 1:1 Sativa Assorted Fruit Chews 10-Pack (100mg CBD, 100mg THC) slid 16.1% to rank 7, indicating flavor-led Sativa edibles are losing momentum even as the overall edible tier still holds multiple top-10 slots. In contrast, CBD/THC/CBG/CBN 1:1 Xtra Strength Dragon Balm Roll on (1000mg CBD, 1150mg THC, 75mg CBG, 75mg CBN, 3.4oz, 100ml) in Topicals inched up 2.3% MoM to hold rank 1 while its Gold Maximum Strength sibling at rank 2 dipped 2.5%, widening the internal gap within the Topical franchise as three Topicals sit inside the top 8. Four of the top ten are Edible SKUs and three are Topicals, but the Topicals concentrate at ranks 1, 2, and 8 while Edibles cluster lower at ranks 3–5 and 7–10, implying Ceres’s commercial direction is tilting toward higher-potency Topicals anchoring the top ranks while Edibles fragment by flavor and format.
Top Selling Cannabis Brands
Data for this report comes from real-time sales reporting by participating cannabis retailers via their point-of-sale systems, which are linked up with Headset’s business intelligence software. Headset’s data is very reliable, as it comes digitally direct from our partner retailers. However, the potential does exist for misreporting in the instance of duplicates, incorrectly classified products, inaccurate entry of products into point-of-sale systems, or even simple human error at the point of purchase. Thus, there is a slight margin of error to consider. Brands listed on this page are ranked in the top twenty within the market and product category by total retail sales volume.

