.svg)

Sep-2026
Sales
Trend
6-Month
Product Count
SKUs
Avg Price
YoY Sales Change
YoY Price Change


Market Insights Snapshot
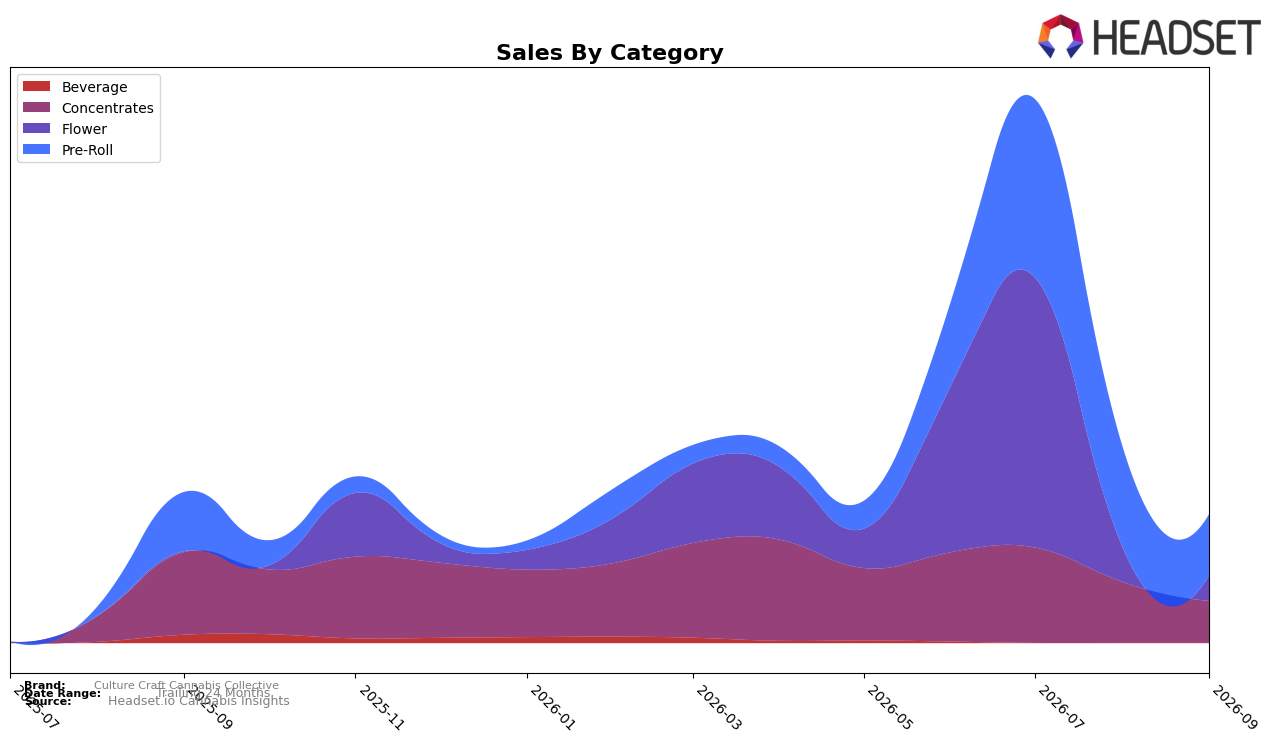
In September 2026, Culture Craft Cannabis Collective’s mix tilted toward Pre-Roll at 47.36% share (ranked 86 in New Jersey Pre-Roll), even as Pre-Roll fell 39.52% month over month and rose 2.99% year over year; Concentrates held 32.54% share with a 31.38% MoM decline and a 49.26% YoY decline; and Flower reached 20.10% share with a 26.13% MoM decline but a 4,168.00% YoY increase. Combined with an average price drop of 14.82% YoY to $19.95 and brand-level sales down 14.51% YoY, the category mix points to a pivot away from higher-ticket Concentrates toward volume-led Pre-Roll and a newly scaled Flower base.
The simultaneous 39.52% MoM pullback in Pre-Roll and 31.38% MoM slide in Concentrates, alongside a 26.13% MoM step-down in Flower, indicates short-term demand compression or inventory gating, while the 4,168.00% YoY surge in Flower and 2.99% YoY gain in Pre-Roll signal repositioning toward accessible formats and price points. With Pre-Roll still holding 47.36% share and Flower up to 20.10%, the mix implies a strategy centered on widening basket reach and reducing price sensitivity, while the 49.26% YoY decline in Concentrates and the 86 rank in New Jersey Pre-Roll suggest headroom to trade shoppers up within value tiers without over-relying on premium concentrate margins.
Competitive Landscape
Culture Craft Cannabis Collective sits at rank #86 in New Jersey Pre-Roll in September 2026, down 8 spots year over year from #78 and 11 spots since June 2026 compared to its rank of #75 three months ago; the brand also slipped 23 places from its peak of #63 in July 2026 to today’s #86. Meanwhile, RYTHM moved up from #3 to #1 and Ozone advanced from #6 to #2 with an 81.1% year-over-year sales increase, indicating that top-tier momentum consolidated at the front of the pack while Culture Craft Cannabis Collective lost relative position; the pattern implies that without a near-term catalyst to regain share, continued rank erosion is more likely than a return to top-70 placement.

Notable Products
The steepest decline came from Knicks In 5 Infused Pre-Roll (1g), down 49.0% month over month while holding rank 2, and Sour Sith Lord Hash Infused Pre-Roll (1g) also fell 36.8% yet remained rank 1, indicating demand concentration despite contraction. Hashy Jungle Fever Infused Pre-Roll (1g) was essentially flat at +0.3% and rank 3, while Rule 34 Infused Pre-Roll (1g) slid 47.8% to rank 7, so four of the top ten are Pre-Roll SKUs dominated by negative momentum and only one marginal gain. With Pre-Roll volatility juxtaposed against a Concentrates entry at rank 4 and Flower entries at ranks 5, 6, and 9 totaling $6,100, the mix implies a pivot opportunity toward non–Pre-Roll formats to stabilize revenue while the flagship Pre-Roll lineup recalibrates.
Top Selling Cannabis Brands






Data for this report comes from real-time sales reporting by participating cannabis retailers via their point-of-sale systems, which are linked up with Headset’s business intelligence software. Headset’s data is very reliable, as it comes digitally direct from our partner retailers. However, the potential does exist for misreporting in the instance of duplicates, incorrectly classified products, inaccurate entry of products into point-of-sale systems, or even simple human error at the point of purchase. Thus, there is a slight margin of error to consider. Brands listed on this page are ranked in the top twenty within the market and product category by total retail sales volume.

