Market Insights Snapshot
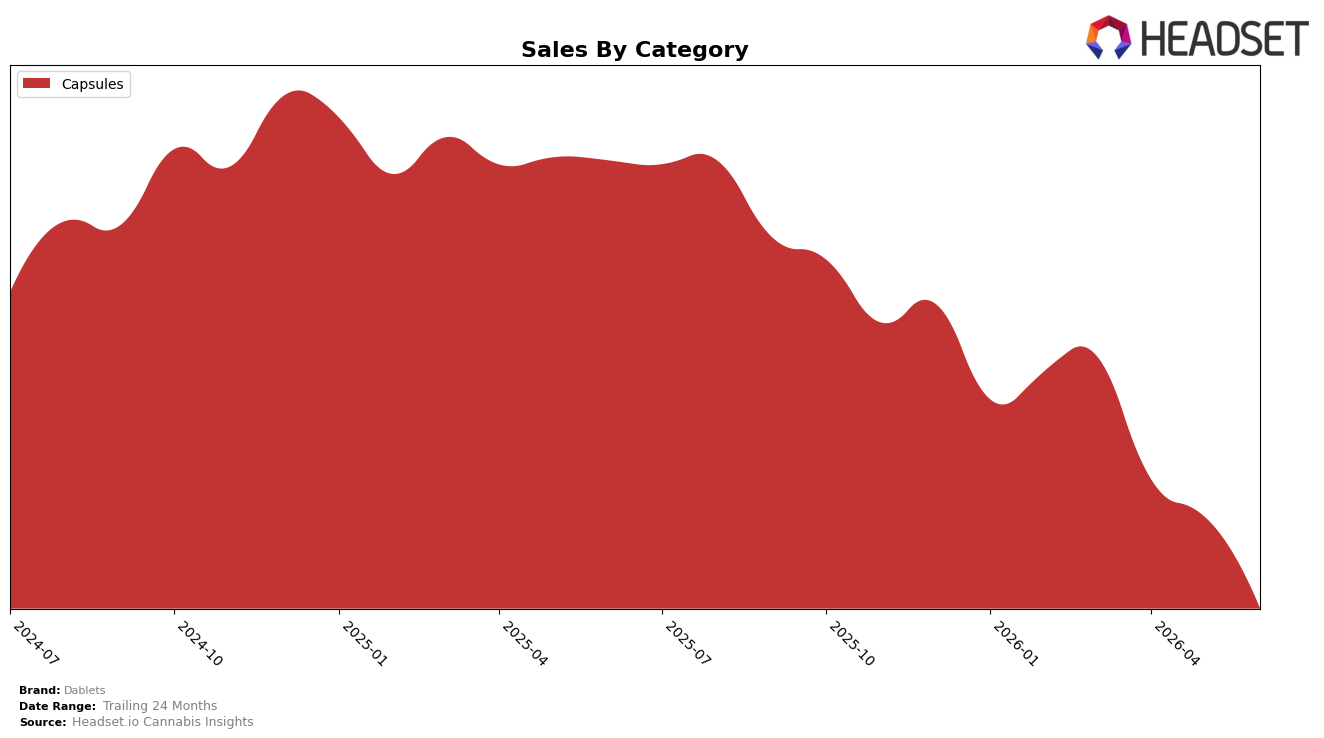
In June 2026, Dablets concentrated entirely in Capsules, with category share at 100.0% and no presence in other formats, while year-over-year sales in Capsules fell by 86.48% and month-over-month declined by 56.63%. Average price in Capsules decreased 14.02% YoY alongside a single-category footprint and a June 2026 category rank not reported in Colorado, implying volume contraction exceeded any price-induced demand lift. The pattern implies a single-category dependence that magnifies volatility and compresses scale efficiency, as a 56.63% MoM drop paired with a 100.0% mix consolidates risk into one channel rather than absorbing shocks across categories.
The shift toward a 100.0% Capsules mix with an 86.48% YoY decline and a 56.63% MoM decline implies a defensive posture rather than an expansion path, as price reductions of 14.02% YoY did not prevent share concentration from turning into exposure. The lack of a reported Capsules rank in Colorado combined with a 24-month sales change of -85.91% suggests strategic over-reliance on a low-price, single-format offer that is unlikely to regain visibility without either category diversification or a margin-aware pricing reset; the implication is that maintaining a lone 100.0% category mix channels all performance sensitivity into Capsules, elevating the risk of further rank volatility.
Competitive Landscape
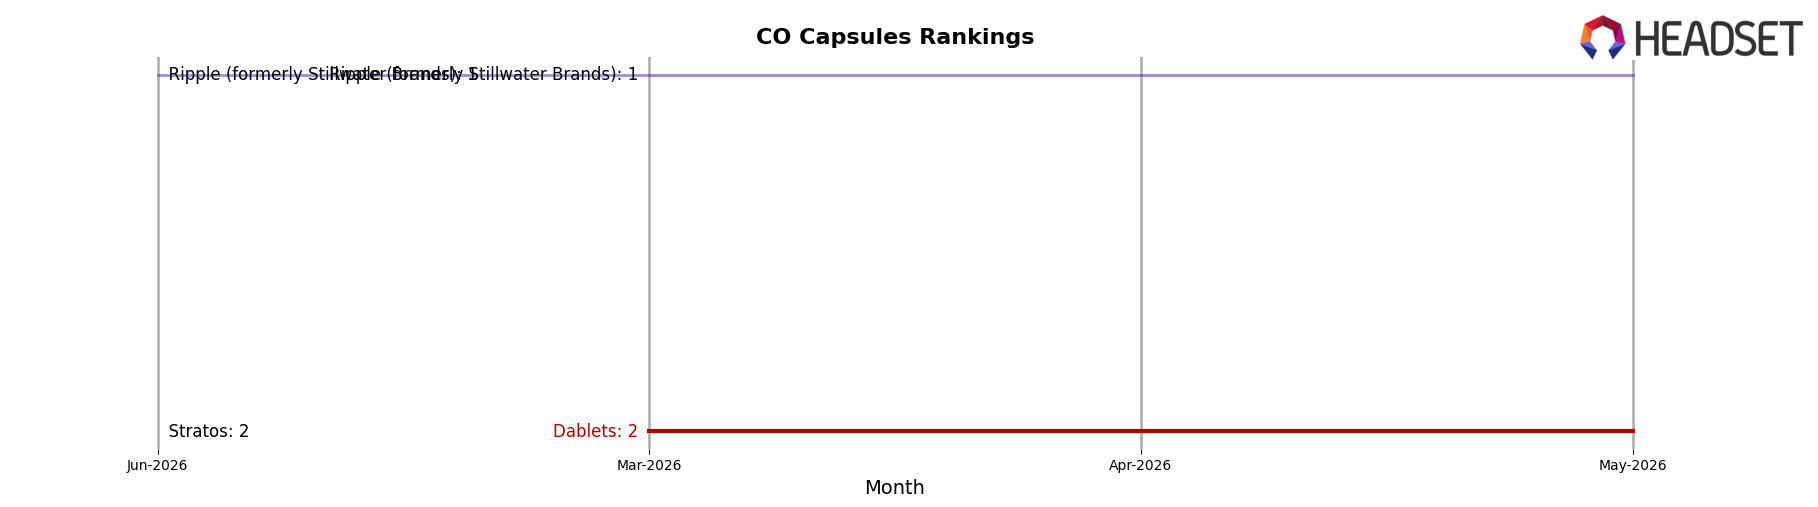
Dablets sits at rank #3 in CO Capsules for June 2026, down one spot year over year from #2, after peaking at #2 in May 2026 and slipping from #2 three months ago to #3 now; in contrast, Ripple (formerly Stillwater Brands) held #1 year over year with a 14.4% YoY sales increase while Stratos climbed from #3 to #2 alongside a 71.7% YoY sales gain, indicating that Dablets’ downgrade from #2 to #3 reflects share being ceded to faster-rising rivals and implies a trajectory where maintaining a top-three position will depend on countering Stratos’s momentum and Ripple’s stability.
Notable Products
Indica Sleep Tablets 10-Pack (100mg) led the movement with an -87.9% month-over-month drop to rank 2, while Sativa Energy Tablets 10-Pack (100mg) fell -32.1% yet held rank 1. Two of the top three SKUs are Capsules in June 2026, concentrating the portfolio around a single form factor even as ranks split between 1 and 2. The steep decline in Indica alongside a smaller decline for Sativa, with Sativa’s $6,334 in sales, indicates demand is consolidating toward daytime use while nighttime need is contracting. This pattern implies Dablets is skewing toward energy-oriented Capsules and may need to rebalance assortment to stabilize the sleep segment.
Top Selling Cannabis Brands
Data for this report comes from real-time sales reporting by participating cannabis retailers via their point-of-sale systems, which are linked up with Headset’s business intelligence software. Headset’s data is very reliable, as it comes digitally direct from our partner retailers. However, the potential does exist for misreporting in the instance of duplicates, incorrectly classified products, inaccurate entry of products into point-of-sale systems, or even simple human error at the point of purchase. Thus, there is a slight margin of error to consider. Brands listed on this page are ranked in the top twenty within the market and product category by total retail sales volume.

