.svg)

Sep-2026
Sales
Trend
6-Month
Product Count
SKUs
Avg Price
YoY Sales Change
YoY Price Change


Where to Buy
Mule Extracts is stocked at 291 licensed dispensaries across Oregon and New Jersey, 235 of them in Oregon, with the deepest coverage in Portland, Eugene, Salem, Medford, and Bend. Search by ZIP code or city below to find the closest one, or filter by product type if you are after a specific format.
Market Insights Snapshot
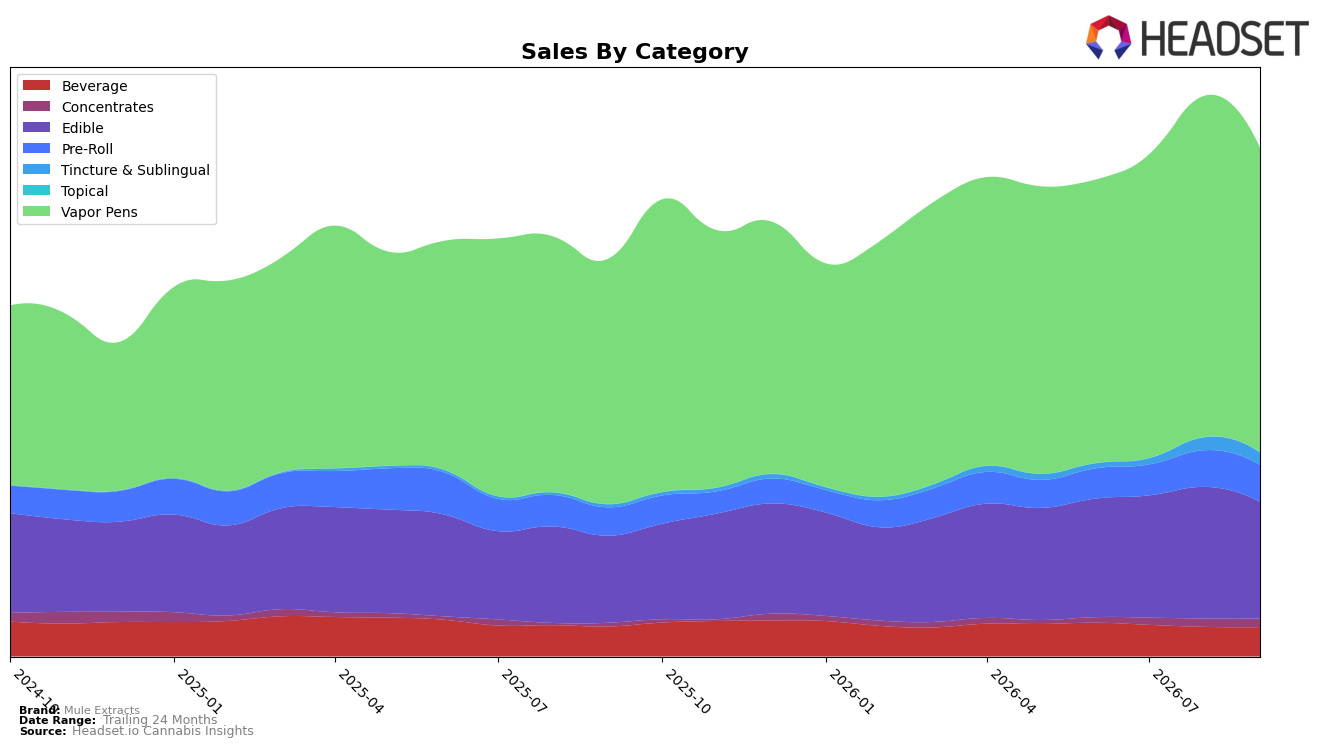
Mule Extracts concentrated 60.06% of September 2026 sales in Vapor Pens with year-over-year growth of 24.25% but a month-over-month decline of 10.75%, while Edible held 22.99% share with 34.30% YoY growth and an 11.27% MoM dip. Pre-Roll contributed 7.20% share with 30.34% YoY growth and a 0.41% MoM uptick, as Beverage at 5.73% share slipped 2.24% YoY and 0.94% MoM. Tincture & Sublingual, though only 2.39% share, surged 347.78% YoY with a 3.57% MoM decline, and Concentrates at 1.62% share rose 141.66% YoY with a 2.44% MoM increase. Taken together with a brand-level 28.11% YoY sales lift and a 1.70% YoY average price increase, the mix signals a portfolio pulling long-term volume from emerging niches while core categories are temporarily softer month to month.
The combination of a 10.75% MoM drop in Vapor Pens alongside a 0.41% MoM rise in Pre-Roll and a 2.44% MoM rise in Concentrates implies share risk in the flagship format and incremental trial shifting toward inhalable alternatives. With Tincture & Sublingual up 347.78% YoY but only 2.39% of mix, and Beverage down 2.24% YoY at 5.73% share, Mule Extracts appears positioned as a Vapor Pens-first brand that is expanding into higher-growth fringes to diversify, while modest price inflation of 1.70% coexists with value-oriented average prices in Edible at $5.74 and Pre-Roll at $4.74; this pattern implies room to defend rank 4 in Vapor Pens in Oregon by stabilizing monthly cadence and selectively leaning into fast-growing small formats.
Competitive Landscape
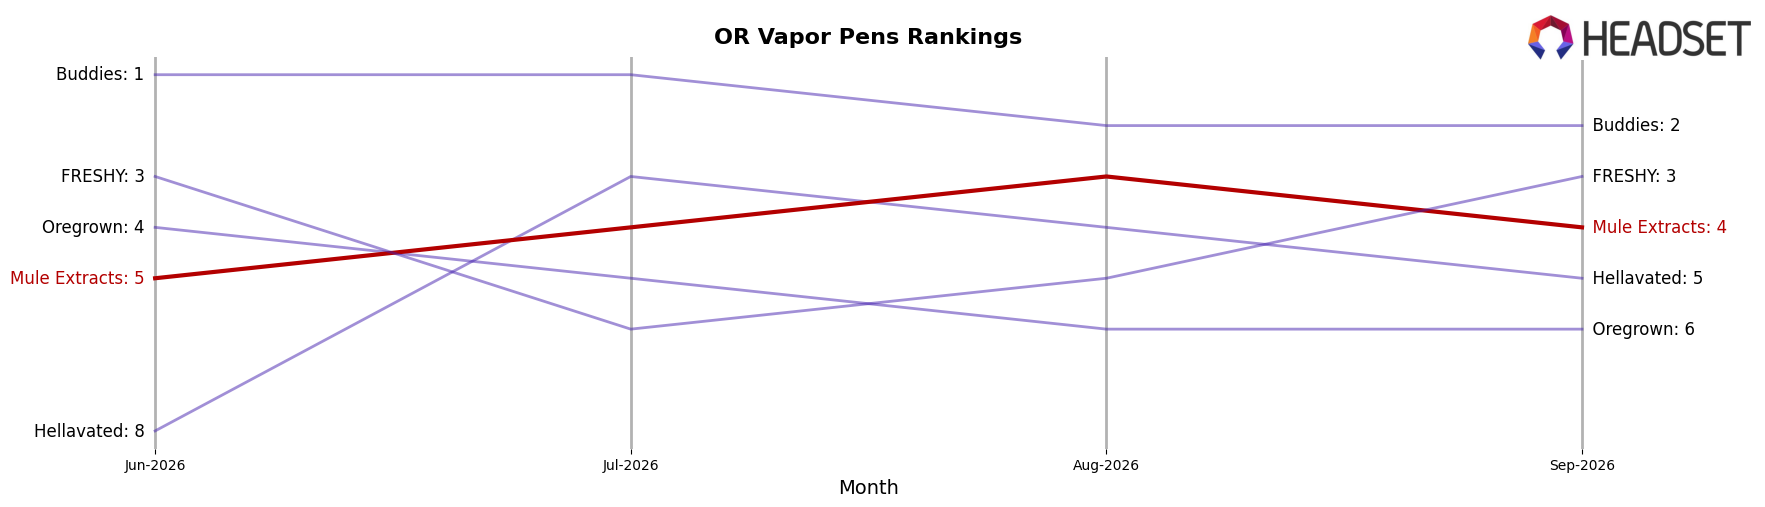
Mule Extracts sits at rank #4 in OR Vapor Pens in September 2026, unchanged from #4 year over year, after edging up from #5 in June 2026 and briefly peaking at #3 in August 2026; in contrast, FRESHY advanced from #5 to #3 with a 5.14% year-over-year sales increase while Hellavated slid from #3 to #5 with a -6.07% decline, and category leader Entourage Cannabis / CBDiscovery remains #1 despite a -15.25% drop. The stable #4 year-over-year rank alongside a one-position improvement since June 2026 suggests Mule Extracts is holding share against declining incumbents but must convert August 2026’s peak at #3 into sustained gains to climb the ladder.
Notable Products
Mini Kicker - Galactic Green Grape Full Spectrum Gummies 2-Pack (100mg) posted the steepest decline at -25.99% while sliding to rank 9, and Mule Kicker - Twisted Citrus Live Resin Gummy (100mg) fell -20.10% at rank 5; together with Nite Qaud Kicker - THC/CBD/CBN/CBG 2:1:4:1 Sour Blackberry Lemonade Gummies 2-Pack (100mg THC, 50mg CBD, 200mg CBN, 50mg CBG) down -16.69% at rank 7, the downdraft concentrates in mid-table SKUs. Offsetting that, Mule Kicker - CBD/THC 1:1 Dragon Fruit Gummies 2-Pack (100mg CBD, 100mg THC) rose +8.23% to rank 2 while the top-ranked Mini Kicker - Raspberry Pomegranate Gummies 10-Pack (100mg) eased only -4.25%, and five other Edible SKUs posted declines between -6.24% and -16.26%. With nine of the top ten coming from Edibles and only one Pre-Roll entrant at rank 8 with no month-on-month baseline, the mix signals dependence on gummies for volume and vulnerability when flavor extensions cool.
Top Selling Cannabis Brands






Data for this report comes from real-time sales reporting by participating cannabis retailers via their point-of-sale systems, which are linked up with Headset’s business intelligence software. Headset’s data is very reliable, as it comes digitally direct from our partner retailers. However, the potential does exist for misreporting in the instance of duplicates, incorrectly classified products, inaccurate entry of products into point-of-sale systems, or even simple human error at the point of purchase. Thus, there is a slight margin of error to consider. Brands listed on this page are ranked in the top twenty within the market and product category by total retail sales volume.

