Jun-2026
Sales
Trend
6-Month
Product Count
SKUs
Avg Price
YoY Sales Change
YoY Price Change
Market Insights Snapshot
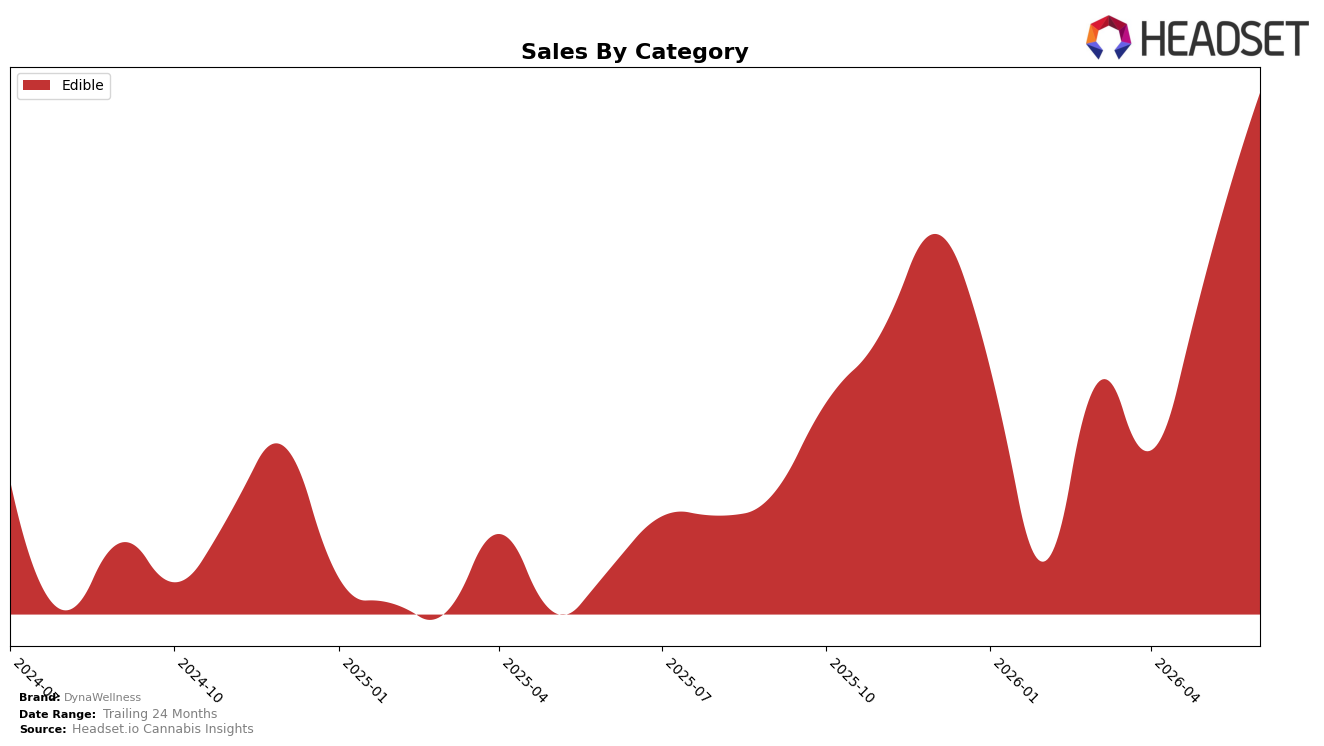
DynaWellness operated as a single-category brand in June 2026, with Edible accounting for 100.0% of sales and rising 193.1% year over year while growing 34.3% month over month; the average price increased 4.1% YoY to $27.29. Within Saskatchewan Edibles, the brand’s rank sat at 14, anchoring its footprint entirely in one format at a middle-of-pack position. The pattern implies a concentration strategy where outsized YoY growth and double-digit MoM momentum are driven by depth in a single form factor rather than breadth across categories.
The combination of 100.0% category concentration and a 4.1% YoY price lift, alongside a 34.3% MoM sales uptick and a 14th-place category rank, implies pricing power supported by velocity gains rather than assortment expansion. The implication for positioning is that June 2026 performance stems from efficiency in Edible execution—sustaining share-of-voice in a single aisle—while the mid-teen rank signals headroom: maintaining the current price architecture while pursuing distribution or pack-size variants could translate the 193.1% YoY surge into rank elevation without immediate reliance on new categories.
Competitive Landscape
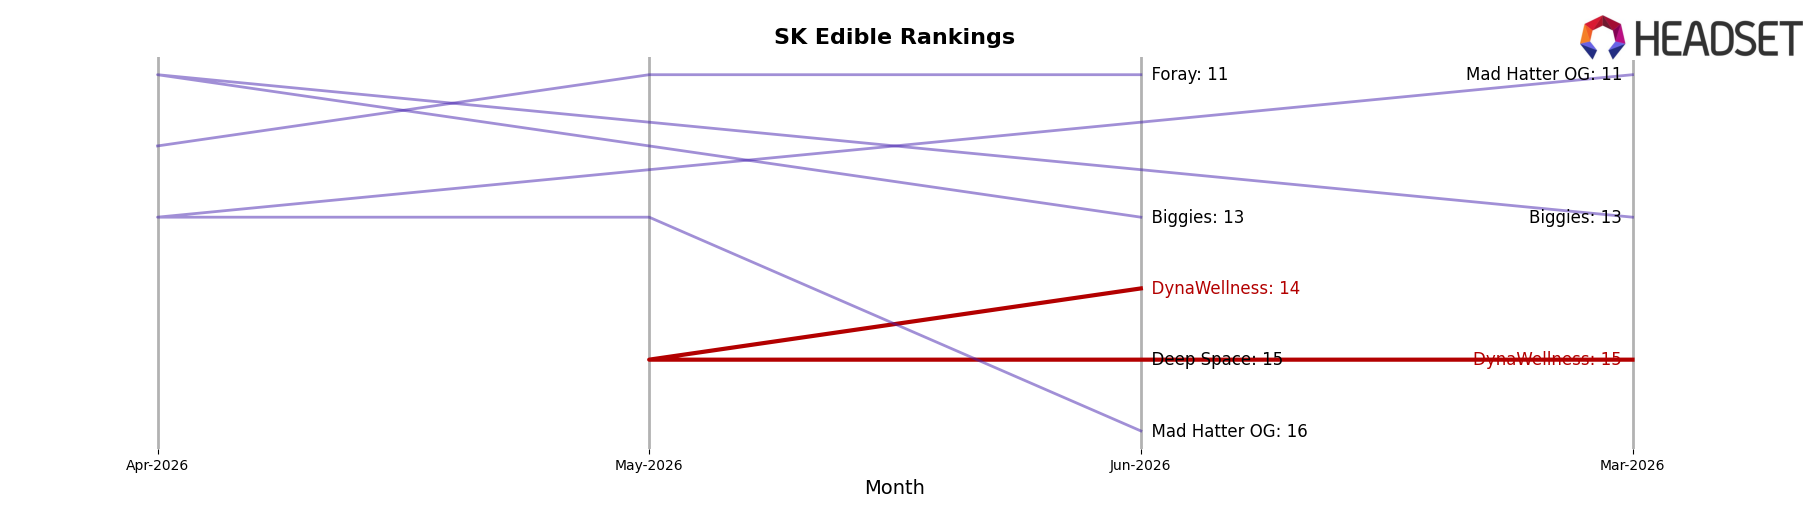
DynaWellness sits at #14 in SK Edible in June 2026 with a 0 rank change year over year (June 2025 to June 2026) and a 1-position lift versus March 2026, while its peak was #13 in November 2025. In contrast, Wyld held #1 with a 2.7% YoY sales increase and Wana climbed from #20 to #4 alongside a 4,937.1% YoY sales gain, indicating upward mobility among leaders as DynaWellness remains static. With Shred steady at #3 and up 110.6% YoY while Gron / Grön slipped one spot from #4 to #5 despite 55.6% YoY growth, the category is redistributing share toward faster risers, implying DynaWellness’s flat rank trajectory is a hold pattern that risks gradual share dilution unless velocity improves.
Notable Products
Dyna Thrive Pro - CBD Blueberry Acai Soft Chews 30-Pack (750mg CBD) led June 2026 with a 34.3% month-over-month increase and held rank 1, while no other SKU posted a comparable move or rank in the top tier. With Edibles accounting for 1 of the top 1 product slots and a 34.3% lift concentrated in a single flagship, the assortment is skewing toward a hero-SKU dynamic rather than a broad-based push. The 30-pack format at 750mg CBD paired growth of 34.3% with a sustained rank 1 position, indicating velocity is consolidating at the premium strength end of the lineup. This pattern implies DynaWellness is tilting its commercial strategy toward deepening share around one high-velocity edible rather than diversifying across multiple SKUs in June 2026.
Top Selling Cannabis Brands
Data for this report comes from real-time sales reporting by participating cannabis retailers via their point-of-sale systems, which are linked up with Headset’s business intelligence software. Headset’s data is very reliable, as it comes digitally direct from our partner retailers. However, the potential does exist for misreporting in the instance of duplicates, incorrectly classified products, inaccurate entry of products into point-of-sale systems, or even simple human error at the point of purchase. Thus, there is a slight margin of error to consider. Brands listed on this page are ranked in the top twenty within the market and product category by total retail sales volume.

