Jun-2026
Sales
Trend
6-Month
Product Count
SKUs
Avg Price
YoY Sales Change
YoY Price Change
Market Insights Snapshot
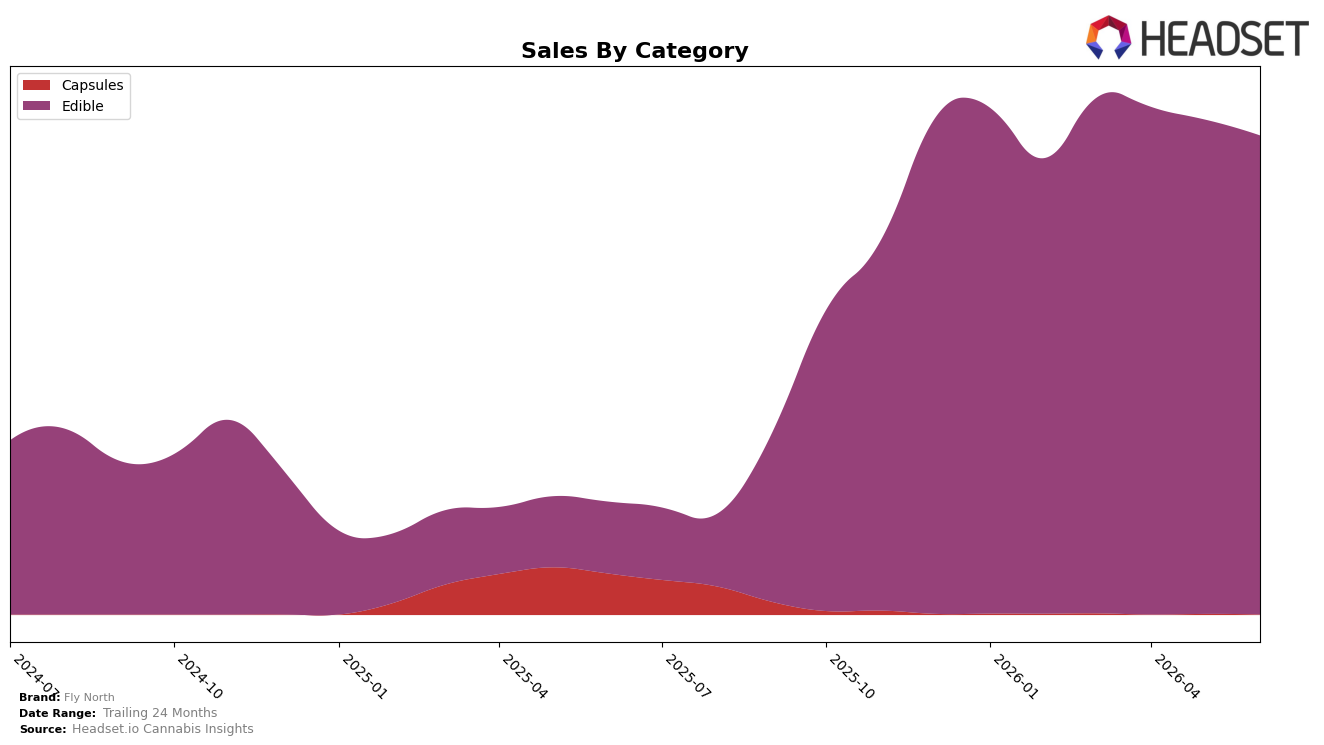
In June 2026, Fly North concentrated 99.98% of sales in Edible while Capsules fell to 0.02% share, with Edible up 569.92% year over year but down 3.10% month over month. Capsules declined 99.81% year over year and 87.50% month over month, signaling an exit-speed contraction that coincides with a 153.12% year-over-year rise in average price and a brand-level 325.52% year-over-year sales increase. The mix shift toward Edible alongside a marginal MoM pullback and a steep Capsules retreat implies the brand is consolidating around a single-category profit engine while pruning low-velocity SKUs.
Within Edible, Fly North holds rank 6 in Ontario, combining a high-share focus (99.98%) with sequential softness of 3.10% and a category-level YoY surge of 569.92%. Pairing the 153.12% increase in average price with 325.52% brand sales growth and a 0.02% residual in Capsules suggests pricing power and assortment depth are doing more work than breadth diversification; the positioning implication is a scale-and-price play in Edible where maintaining rank 6 will depend on stabilizing MoM variability while defending the elevated price architecture.
Competitive Landscape
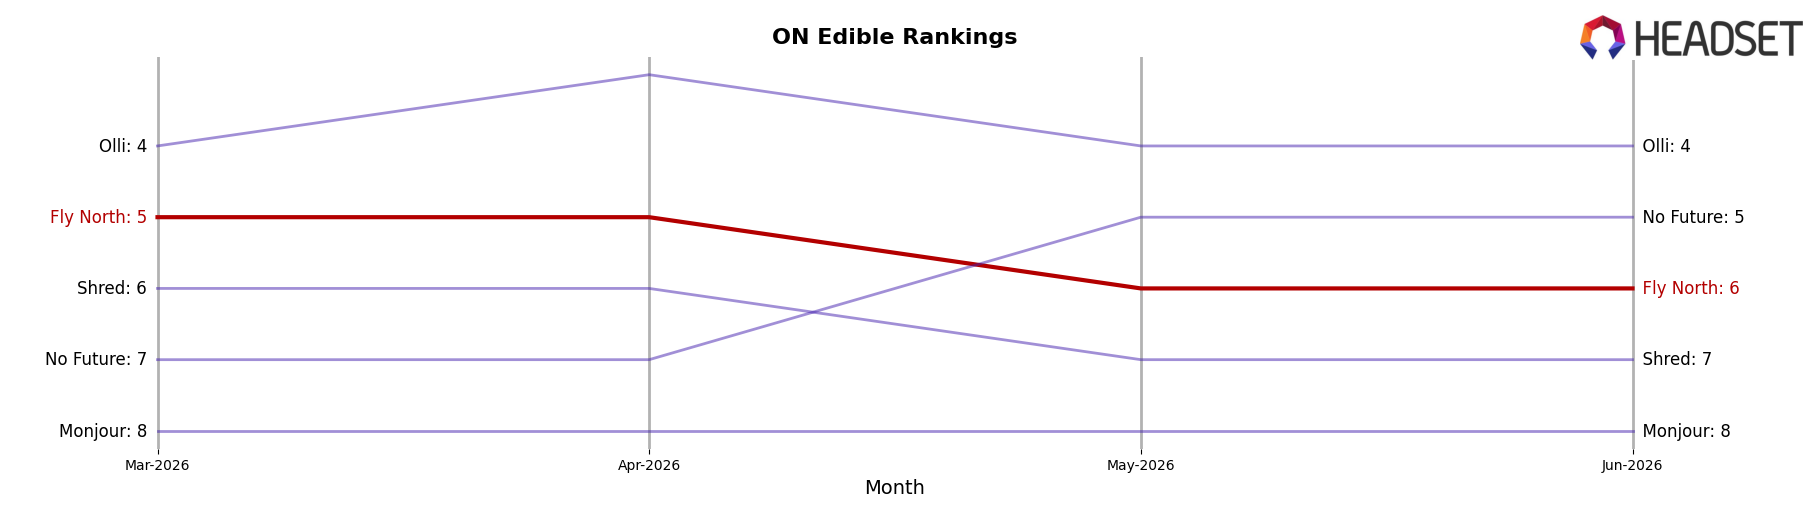
Fly North sits at rank #6 in ON Edible in June 2026, improving 10 positions from #16 year over year, but slipping 1 spot from a peak of #5 in April 2026 to #6 in June 2026; this contrasts with Wyld rising from #4 to #3 alongside a 21.9% YoY sales lift and Olli advancing from #7 to #4 with a 120.7% YoY increase, while Spinach held #1 year over year with a 9.9% YoY gain. The quarter-over-quarter dip from #5 in March–April to #6 in June pairs with competitors consolidating share upward—such as No Future holding #5 with a 47.3% YoY increase—implying Fly North’s trajectory is upward year over year but at risk of being outpaced unless it converts April 2026’s #5 peak into sustained top‑5 tenure.
Notable Products
Space Tokens -Wild Strawberry Splash Live Rosin Chews 10-Pack (100mg) posted the standout move in June 2026 with a +77.5% month-over-month surge to rank 1, while Sour Passion Fruit Soft Chew (10mg) slid -17.9% to rank 6. Space Tokens- Platinum Blueberry Live Rosin Soft Chew 10-Pack (100mg) dipped -8.0% but still held rank 2, and Space Tokens - Sativa Citrus Sizzle Soft Chew 10-Pack (100mg) added +5.3% at rank 5. Eight of the top ten are Edible Soft Chews under the Space Tokens and soft chew families, signaling a tilt toward higher-potency 100mg packs that can absorb single-SKU volatility while concentrating share in a few lead flavors.
Top Selling Cannabis Brands
Data for this report comes from real-time sales reporting by participating cannabis retailers via their point-of-sale systems, which are linked up with Headset’s business intelligence software. Headset’s data is very reliable, as it comes digitally direct from our partner retailers. However, the potential does exist for misreporting in the instance of duplicates, incorrectly classified products, inaccurate entry of products into point-of-sale systems, or even simple human error at the point of purchase. Thus, there is a slight margin of error to consider. Brands listed on this page are ranked in the top twenty within the market and product category by total retail sales volume.

