Market Insights Snapshot
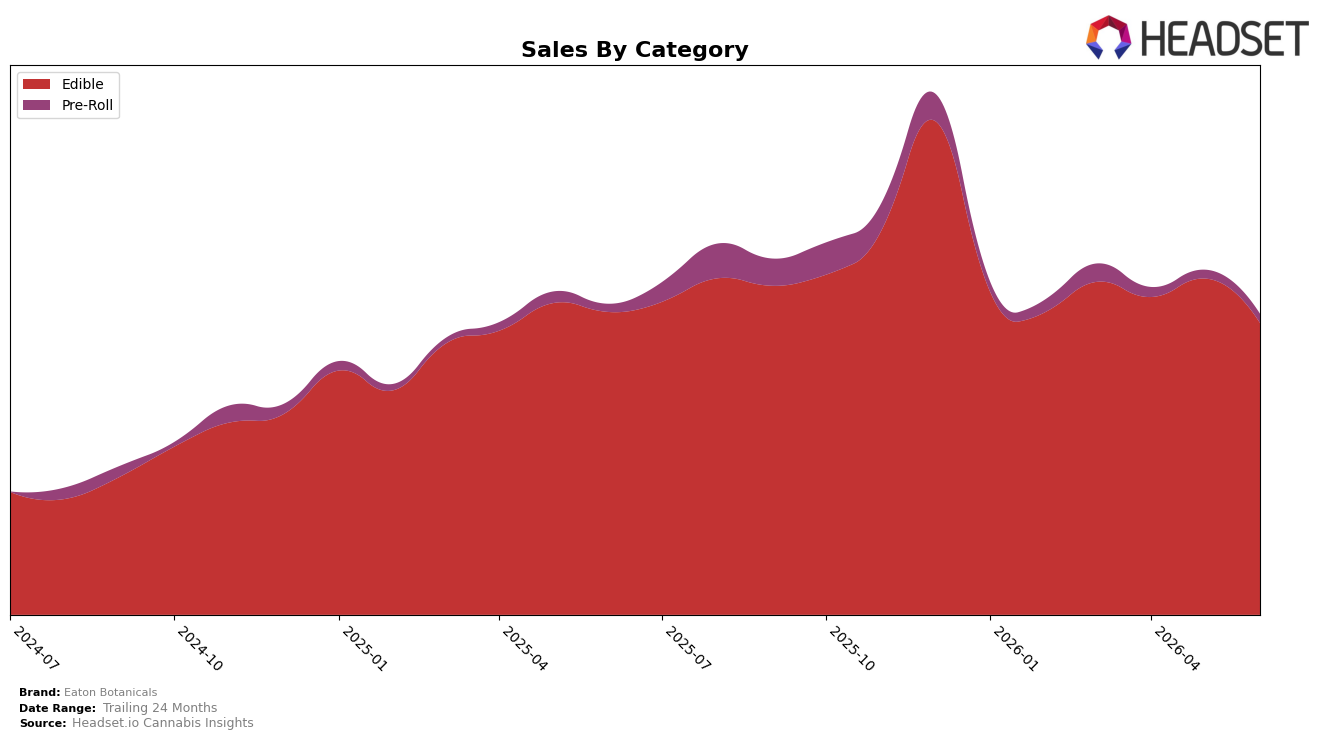
In June 2026, Eaton Botanicals concentrated 97.05% of sales in Edible while Pre-Roll accounted for 2.95%, indicating a near-single-category footprint that still shifted at the margin. Edible contracted by 13.25% month over month and 3.66% year over year, while Pre-Roll expanded by 5.11% MoM and 14.44% YoY, nudging the mix away from a 100% Edible skew. The average price moved down 1.64% YoY to $30.77, aligned with Edible’s 30.92 average price, suggesting the category’s price points anchor overall ticket size more than the smaller Pre-Roll line. With an Edible rank of 9 in New York and a 3.21% brand-level YoY sales decline against a 374.40% 24‑month expansion, the data implies a short-term pullback concentrated in the core category while the small but growing Pre-Roll line provides incremental volume insulation.
The mix shift—down 13.25% MoM in Edible versus up 5.11% MoM in Pre-Roll and a 14.44% YoY Pre-Roll lift against a 3.66% YoY Edible dip—implies Eaton Botanicals is relying on a dominant Edible base to retain its rank of 9 but is testing category adjacency to reduce volatility. A 1.64% YoY price deflation alongside a 97.05% Edible share means pricing levers in Edible carry outsized impact, so modest Pre-Roll gains (2.95% share) act more as a hedge than a growth engine at current scale. The pattern suggests near-term positioning as an Edible-led brand stabilizing share through incremental Pre-Roll presence rather than broad diversification, implying execution focus should prioritize Edible velocity recovery while selectively scaling the higher-growth but small Pre-Roll contribution.
Competitive Landscape
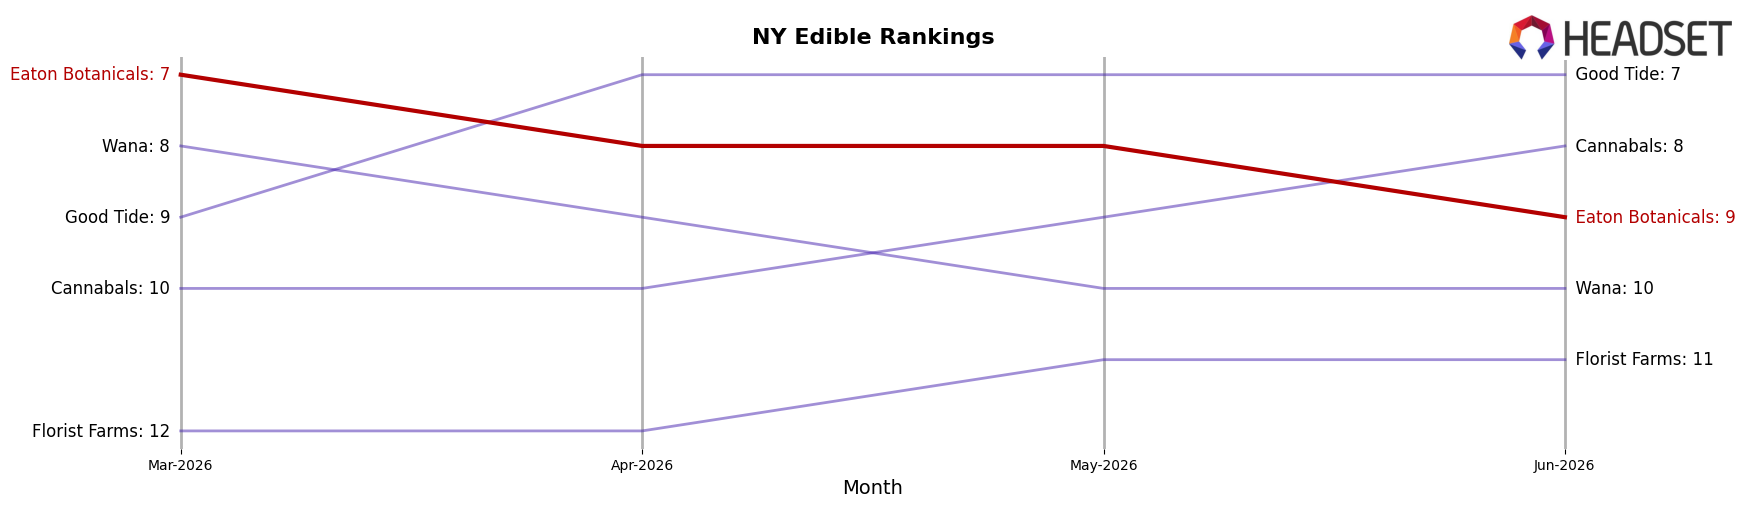
Eaton Botanicals sits at rank #9 in NY Edible for June 2026, down 1 position from #8 year over year and 2 spots below its March 2026 peak at #7, indicating a 2-rank slide from March 2026 to June 2026 and a 1-rank decline versus June 2025; meanwhile, Off Hours fell from #1 to #2 as Wyld held steady at #3, creating a top tier that is consolidating as Eaton Botanicals moves from #7 three months ago to #9 now. With Gron / Grön fixed at #4 and Mfny (Marijuana Farms New York) improving from #6 to #5 while Eaton Botanicals retreats from #8 to #9 year over year, the directional gap at the upper mid-table is widening, implying Eaton Botanicals’ rank trajectory points toward share pressure unless it reverses the two-position decline since March 2026.
Notable Products
Little Pandas - Tropical Cooler x Cherry Lime Reserve Pre-Roll 5-Pack (1.75g) posted the steepest decline at -51.3% MoM and slid to rank 9, while Nightly Nightcap - THC/CBN 1:1 Dark Cherry Gummies 20-Pack (100mg THC, 100mg CBN) fell -23.0% MoM but still held rank 1. Daily Elevation - CBG/THC 1:1 Peach Gummies 20-Pack (100mg CBG, 100mg THC) dropped -21.9% MoM at rank 2, and Serenity Now - CBD/THC 4:1 Lemon Lavender Gummies 20-Pack (200mg CBD, 50mg THC) eased -7.7% MoM at rank 3, signaling broad softness at the top. Eight of the top ten are Edible SKUs, yet the only notable MoM gain came from Little Pandas - Space Panda x Snow Panda Pre-Roll 5-Pack (1.75g) at +33.3% to rank 8, indicating a pockets-of-demand shift toward Pre-Rolls even as gummies dominate share by rank. The pattern implies Eaton Botanicals is over-indexed to Edibles for June 2026 and may need to diversify into faster-moving formats to stabilize momentum.
Top Selling Cannabis Brands
Data for this report comes from real-time sales reporting by participating cannabis retailers via their point-of-sale systems, which are linked up with Headset’s business intelligence software. Headset’s data is very reliable, as it comes digitally direct from our partner retailers. However, the potential does exist for misreporting in the instance of duplicates, incorrectly classified products, inaccurate entry of products into point-of-sale systems, or even simple human error at the point of purchase. Thus, there is a slight margin of error to consider. Brands listed on this page are ranked in the top twenty within the market and product category by total retail sales volume.

