.svg)

Aug-2026
Sales
Trend
6-Month
Product Count
SKUs
Avg Price
YoY Sales Change
YoY Price Change


Market Insights Snapshot
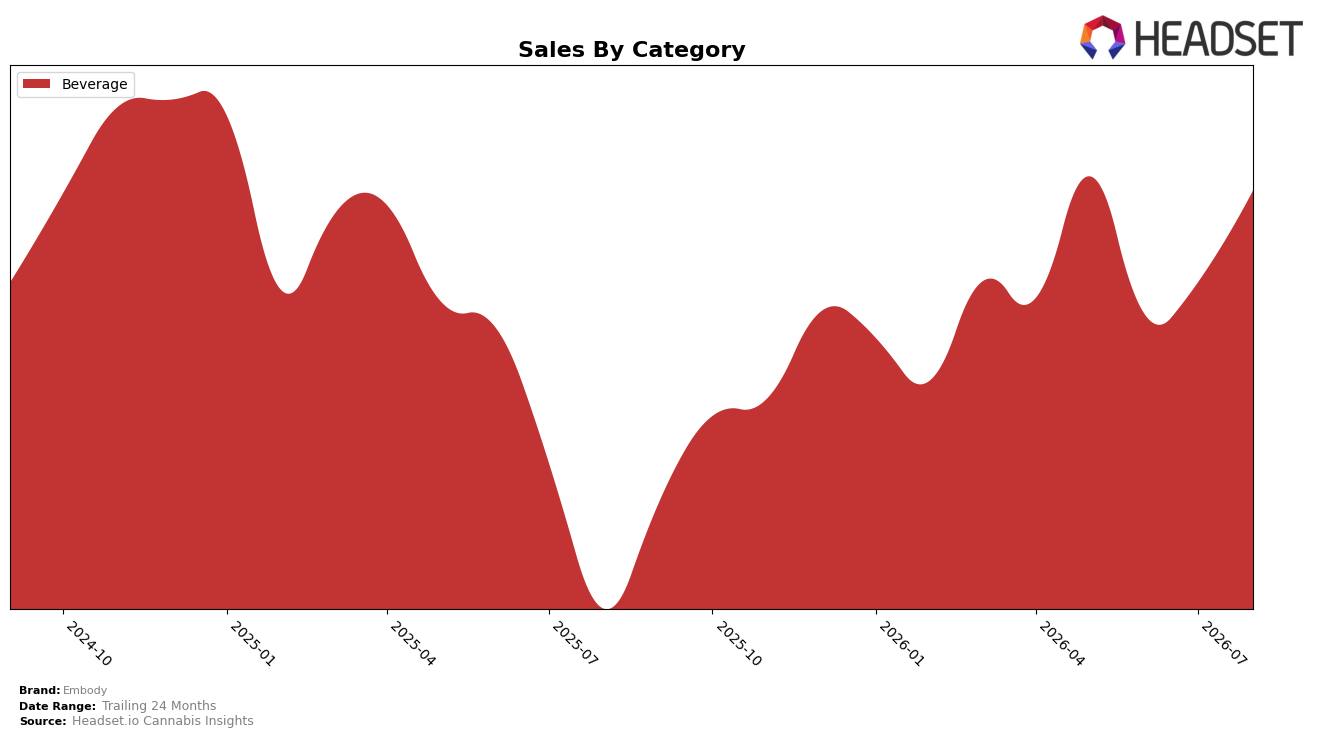
Embody’s August 2026 mix is fully concentrated in Beverage at 100.0% share, with category sales up 104.3% year over year and 12.6% month over month, while average price rose 3.5% YoY alongside a 12.6% MoM sales lift. Within Ontario Beverage, the brand sits at rank 22, pairing a triple‑digit YoY gain with a mid‑tier position; the combination of 100.0% category concentration and a 12.6% MoM acceleration implies focus over diversification.
The single‑category strategy in Beverage, combined with a 104.3% YoY sales expansion and a 3.5% YoY price increase, indicates demand growth is outpacing price inflation, and the 12.6% MoM uptick alongside rank 22 in Ontario suggests headroom remains within the mid‑pack. The pattern implies Embody is trading on volume gains within Beverage rather than mix shifts, and that maintaining pricing while pursuing share lift from rank 22 could be more effective than expanding into adjacent categories in the near term.
Competitive Landscape
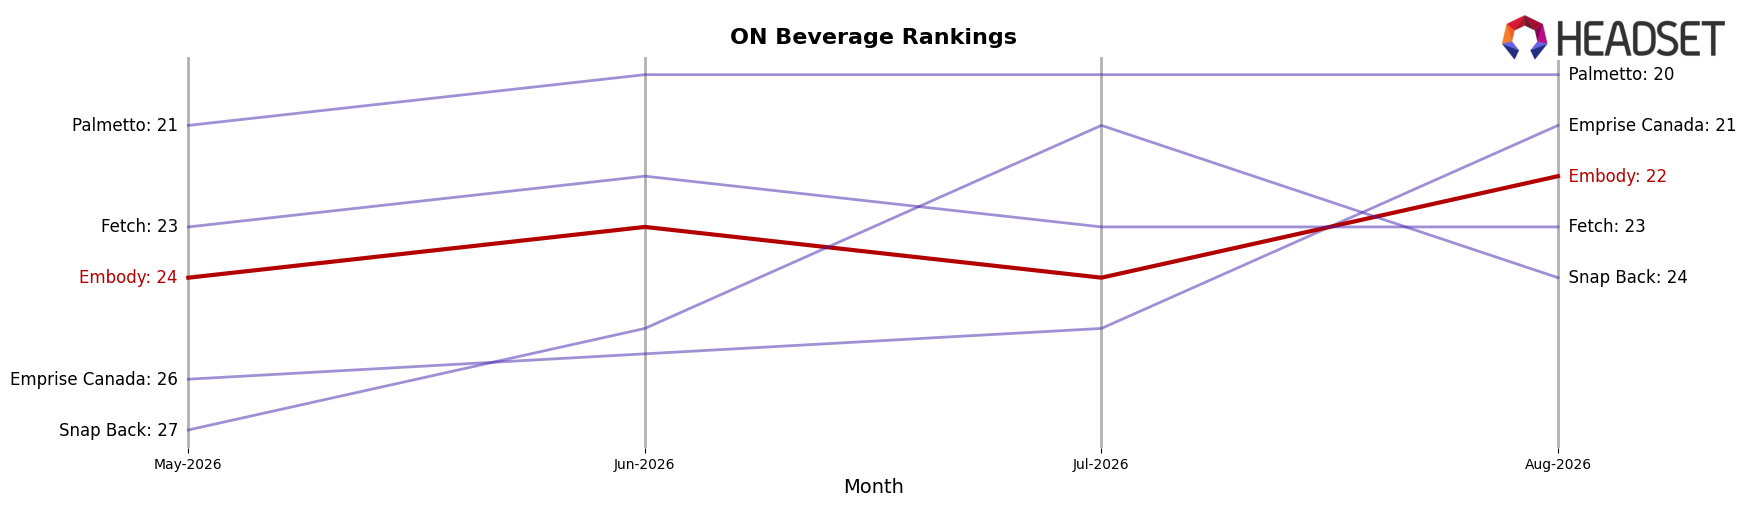
Embody sits at rank #22 in ON Beverage in August 2026, improving 8 spots from #30 year over year, but only 2 spots from #24 in May 2026, indicating the bulk of gains came earlier in the year; the brand’s peak was #21 in December 2025, just 1 rank above today, which suggests a ceiling near the low-20s. Meanwhile, XMG held #1 year over year to #1 currently despite a 31.4% YoY sales decline, and Versus climbed from #3 to #2 with 7.0% YoY growth, implying that rank mobility at the top is driven more by competitor contraction than category-wide expansion. With Embody up 8 ranks YoY yet flat versus its December 2025 peak by only 1 rank, the trajectory implies incremental share capture but a stall near the top-20 threshold unless distribution or velocity shifts widen beyond the modest 2-rank change since May 2026.
Notable Products
CBD/THC Peach + Ginger White Sparkling White Tea (40mg CBD, 2mg THC, 355ml) led August 2026 with rank 1 and a month-over-month increase of 8.1%, while CBD/THC Blood Orange + Rosemary Tea (40mg CBD, 2mg THC, 355ml) sat at rank 2 with a 46.7% lift. Both top-2 SKUs are Beverages, concentrating category exposure at the summit of the lineup and indicating that Embody is consolidating demand around a narrow flavor-led sparkling tea platform rather than diversifying formats.
Top Selling Cannabis Brands






Data for this report comes from real-time sales reporting by participating cannabis retailers via their point-of-sale systems, which are linked up with Headset’s business intelligence software. Headset’s data is very reliable, as it comes digitally direct from our partner retailers. However, the potential does exist for misreporting in the instance of duplicates, incorrectly classified products, inaccurate entry of products into point-of-sale systems, or even simple human error at the point of purchase. Thus, there is a slight margin of error to consider. Brands listed on this page are ranked in the top twenty within the market and product category by total retail sales volume.

