.svg)
Sep-2026
Sales
Trend
6-Month
Product Count
SKUs
Avg Price
YoY Sales Change
YoY Price Change


Market Insights Snapshot
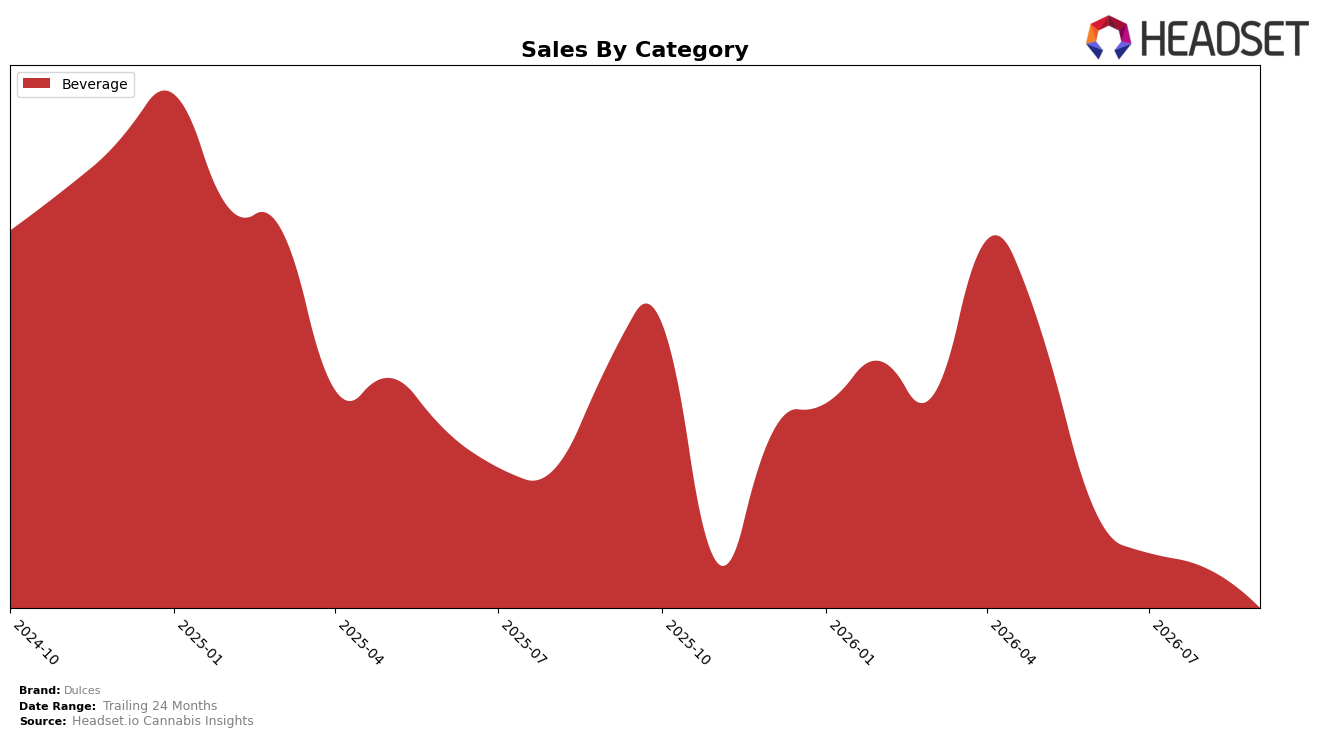
In September 2026, Dulces operated as a single-category brand, with Beverage accounting for 100.0% of sales and a month-over-month decline of 26.0% alongside a year-over-year drop of 68.1%. The average price fell 4.4% year over year to $6.52, pairing price compression with volume contraction, and the absence of any non-Beverage contribution left no offset to the category-specific downturn. With Beverage as both the top category and the sole driver, the mix concentration amplifies exposure to single-category volatility, implying that September 2026 performance was dictated more by category headwinds than by intra-portfolio balancing.
The tightened focus in Beverage, combined with a 26.0% month-over-month drawdown and a 68.1% year-over-year contraction, positions Dulces as a narrow specialist rather than a diversified player in September 2026. In Ontario, where the rank is unreported, a 4.4% price decrease suggests a trade-down or promotional leaning that did not translate into share defense, given the 100.0% category reliance. The pattern implies Dulces should reassess its Beverage SKU roles and price ladders to stabilize mix risk, because concentration without offsetting growth lanes magnifies downside during monthly and annual category dips.
Competitive Landscape
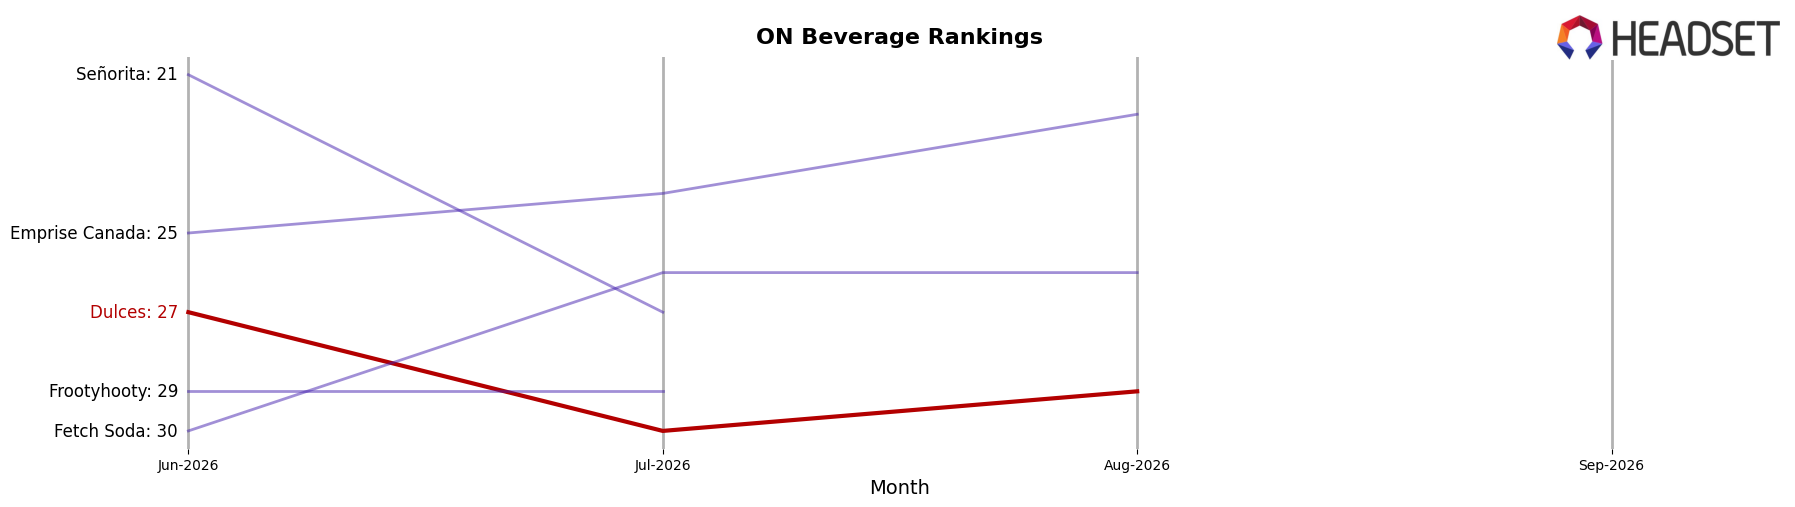
Dulces sits at #32 in ON Beverage in September 2026, down 12 ranks year over year from #20, and 5 spots softer than three months ago at #27; the brand’s peak at #16 in April 2026 contrasts with the current position to mark a 16-rank slide from that high. While Versus advanced to #1 from #2 with 9.7% year-over-year sales growth and Mary Jones rose to #5 from #8 alongside a 53.6% year-over-year lift, Dulces’ YoY rank decline and quarter-over-quarter slippage indicate share is migrating toward faster-rising incumbents; the trajectory implies Dulces is transitioning from mid-tier contender toward the lower tier unless it reverses the rank loss seen since April 2026.
Notable Products
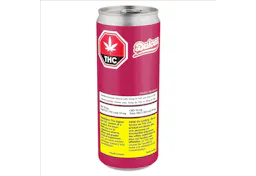
The steepest decline came from CBD/THC 1:1 Sweet Peach Sparkling Beverage (10mg CBD, 10mg THC 355ml), down 47.5% month over month and slipping to rank 3, while CBD/THC 1:1 Watermelon Sparkling Beverage (10mg CBD, 10mg THC, 12oz, 355ml) held rank 1 with a 6.7% drop. CBD:THC 1:1 Fruity Berry Beverages (10mg CBD, 10mg THC, 12oz, 355ml) stayed at rank 2 with a 6.9% month-over-month decline, and together these three Beverage SKUs occupied ranks 1 through 3, concentrating the top tier in one category. With three of the top ten as Beverage SKUs and only Watermelon still generating $4,759, the pattern implies Dulces is leaning on a narrow Beverage-led lineup whose leadership can persist through mild pullbacks but is vulnerable when a flavor like Sweet Peach contracts sharply.
Top Selling Cannabis Brands






Data for this report comes from real-time sales reporting by participating cannabis retailers via their point-of-sale systems, which are linked up with Headset’s business intelligence software. Headset’s data is very reliable, as it comes digitally direct from our partner retailers. However, the potential does exist for misreporting in the instance of duplicates, incorrectly classified products, inaccurate entry of products into point-of-sale systems, or even simple human error at the point of purchase. Thus, there is a slight margin of error to consider. Brands listed on this page are ranked in the top twenty within the market and product category by total retail sales volume.

