.svg)

Aug-2026
Sales
Trend
6-Month
Product Count
SKUs
Avg Price
YoY Sales Change
YoY Price Change



Where to Buy
Soundview is stocked at 51 licensed dispensaries across Connecticut, with the deepest coverage in Hamden, Norwalk, West Hartford, Bristol, and Danbury. Search by ZIP code or city below to find the closest one, or filter by product type if you are after a specific format.
Market Insights Snapshot
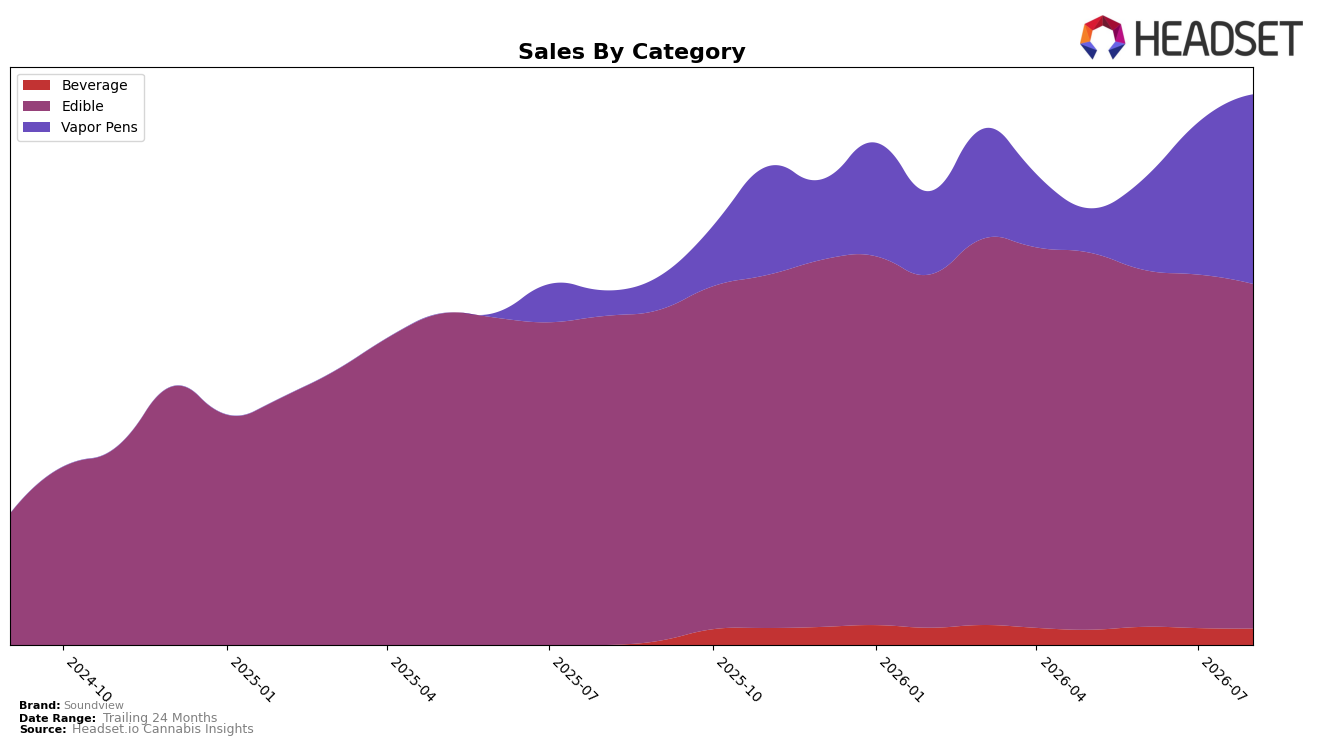
Soundview’s category mix in August 2026 leaned on Edible at 62.56% share with year-over-year growth of 4.70% but month-over-month contraction of 2.54%, while Vapor Pens expanded to 34.44% share with 647.29% year-over-year growth and 24.60% month-over-month growth. Beverage remained a small 3.00% share with a 2.65% month-over-month decline and no year-over-year basis reported, and the brand’s average price rose 3.76% year over year to $28.998 while Edible average price sat at $29.06. In Connecticut Edible, Soundview held rank 1, indicating leadership even as mix shifts toward Vapor Pens accelerate; the pattern implies the brand is using Edible scale to fund and absorb volatility while pivoting into a faster-growing pen segment.
These shifts imply Soundview is transitioning from an Edible-centric portfolio toward a two-pillar stance where Vapor Pens’ 24.60% month-over-month expansion and 647.29% year-over-year surge offset Edible’s 2.54% monthly pullback and moderate 4.70% annual rise. With Edible still at 62.56% share and rank 1 in Connecticut, the brand can trade some Edible mix for Vapor Pens without near-term rank risk, positioning for higher-velocity growth while Beverage’s 3.00% share and 2.65% monthly decline remain a contained tail. The implication is a managed reweighting: maintain Edible leadership to anchor price and retention while channeling incremental demand into Vapor Pens to drive overall sales growth of 55.39% year over year.
Competitive Landscape
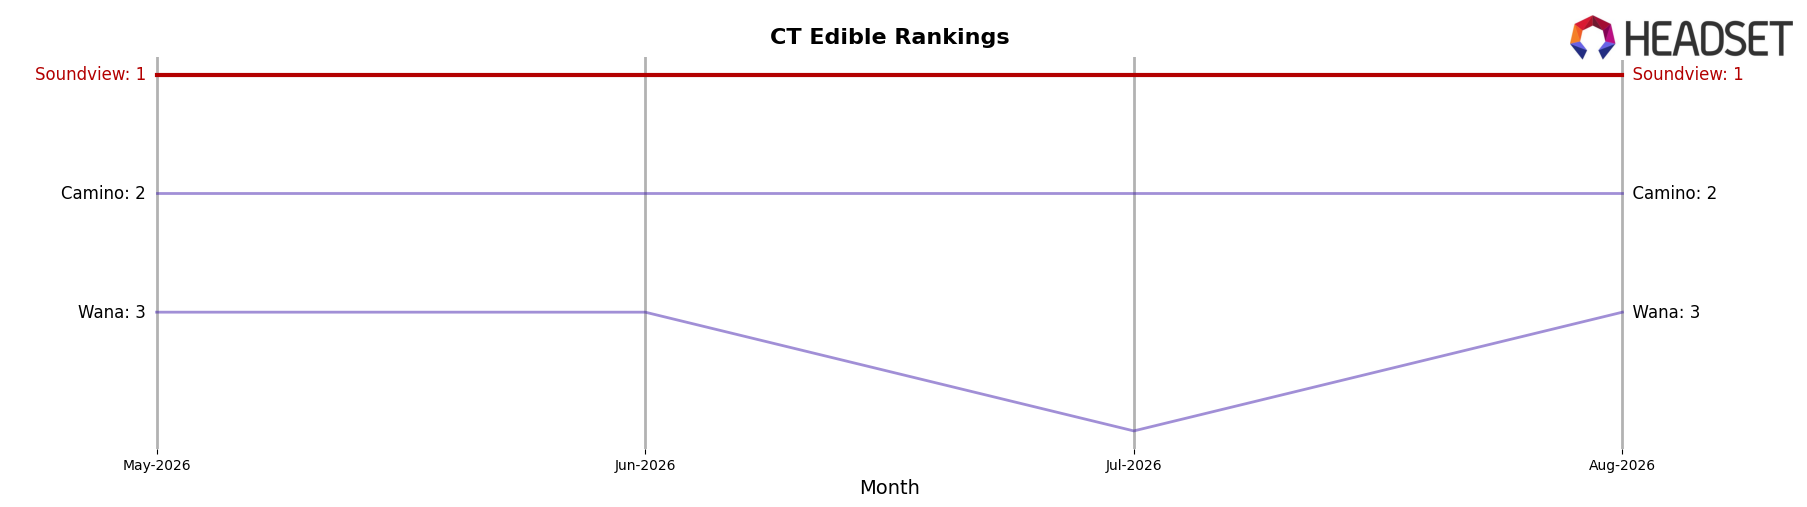
Soundview is ranked #1 in CT Edible in August 2026, up 1 position year over year from #2, and it has held #1 for three consecutive months while also matching its peak rank in August 2026; this climb contrasts with Camino improving from #4 to #2 and Encore Edibles sliding from #1 to #4 on a -56.3% year-over-year sales change. Meanwhile, Wana is static at #3 with +22.5% year-over-year sales, and Asteroid Cannabis vaulted from #13 to #5 on +741.1% year-over-year sales, indicating Soundview’s move to #1 is less about a one-off spike and more about sustained outperformance relative to both a fast-rising challenger and a declining incumbent.
Notable Products
Pink Lemonade Live Resin Gummies 20-Pack (100mg) posted the steepest decline in August 2026 at -36.4% MoM, sliding to rank 6 while Sativa Blood Orange Gummies 20-Pack (100mg) fell -13.7% MoM and held rank 3. At the top, CBN/THC 5:1 BlueZZZberry Gummies 20-Pack (500mg CBN, 100mg THC) grew 11.2% MoM to remain rank 1, and THC/CBN 2:1 G'Night Grape Gummies 20-Pack (100mg THC, 50mg CBN) added 3.8% MoM at rank 2; eight of the top ten are Edible SKUs, concentrating category weight despite mixed momentum. The Beverage entries were comparatively flat, with CBG/CBD/THC 1:1:1 Blood Orange Seltzer (3mg CBG, 3mg CBD, 3mg THC, 12oz, 355ml) at -1.0% MoM in rank 4 and CBD/CBG/THC 1:1:1 Lemon Lime Seltzer (3mg CBD, 3mg CBG, 3mg THC, 12oz, 355ml) at +4.0% MoM in rank 9, while Strawberry Kiwi Fast Acting Gummies 20-Pack (100mg) declined -12.2% MoM at rank 10. The pattern implies Soundview is leaning into sleep-focused cannabinoids and Edible dominance, with volatility inside fruit-forward THC gummies suggesting mix optimization rather than category expansion should drive near-term gains.
Top Selling Cannabis Brands






Data for this report comes from real-time sales reporting by participating cannabis retailers via their point-of-sale systems, which are linked up with Headset’s business intelligence software. Headset’s data is very reliable, as it comes digitally direct from our partner retailers. However, the potential does exist for misreporting in the instance of duplicates, incorrectly classified products, inaccurate entry of products into point-of-sale systems, or even simple human error at the point of purchase. Thus, there is a slight margin of error to consider. Brands listed on this page are ranked in the top twenty within the market and product category by total retail sales volume.

