.svg)

Sep-2026
Sales
Trend
6-Month
Product Count
SKUs
Avg Price
YoY Sales Change
YoY Price Change


Where to Buy
Eureka is stocked at 377 licensed dispensaries across New York, Colorado, and 6 other states, 114 of them in New York, with the deepest coverage in New York, Queens, Brooklyn, Syracuse, and Farmingdale. Search by ZIP code or city below to find the closest one, or filter by product type if you are after a specific format.
Market Insights Snapshot
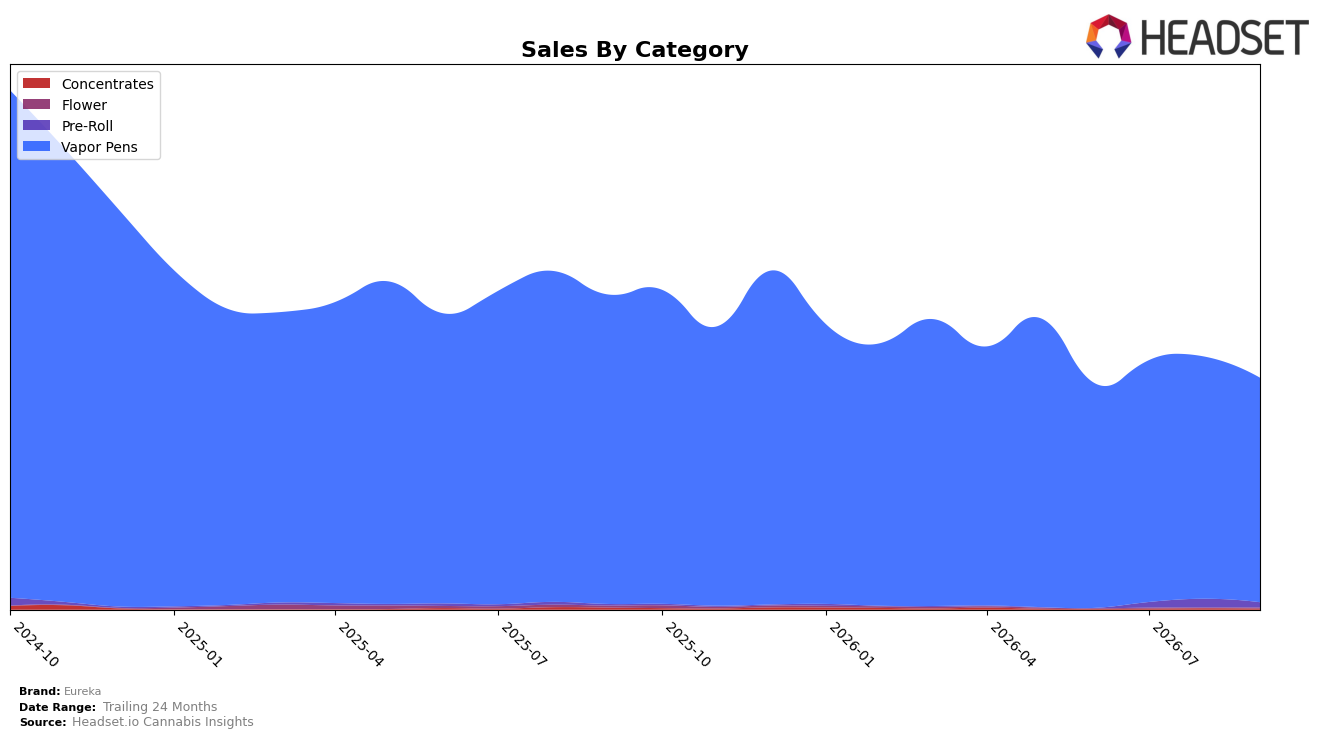
Eureka’s mix in September 2026 stayed concentrated in Vapor Pens at 97.38% share, with that anchor category down 27.49% year over year and 7.29% month over month, while Pre-Roll rose 337.09% year over year but fell 42.26% month over month to just 2.07% share. Smaller lines were volatile: Flower grew 141.57% month over month after a 56.80% year-over-year decline to 0.28% share, and Concentrates slid 37.59% month over month and 63.27% year over year to 0.27% share. Average price across the brand fell 9.99% year over year to $31.07, and within Vapor Pens averaged 31.88, as Eureka held a Vapor Pens rank of 12 in Colorado. The pattern implies a portfolio still tethered to a contracting Vapor Pens core while nascent categories are too small and volatile to offset category-specific headwinds month to month.
With Vapor Pens carrying 97.38% of sales alongside a 27.49% year-over-year decline and a 7.29% month-over-month dip, Eureka’s positioning remains highly exposed to a single-category downswing, and the 12th-place rank in Colorado suggests limited cushion if price mix continues to compress by 9.99% year over year. The spike in Flower month over month at 141.57% alongside a 42.26% month-over-month retreat in Pre-Roll indicates experimentation rather than a durable rebalancing, given their combined 2.35% share. This implies the near-term path to defend share is through sharpening the Vapor Pens value proposition at a $31–32 price point while selectively scaling secondary categories to dilute risk without materially cannibalizing the core.
Competitive Landscape
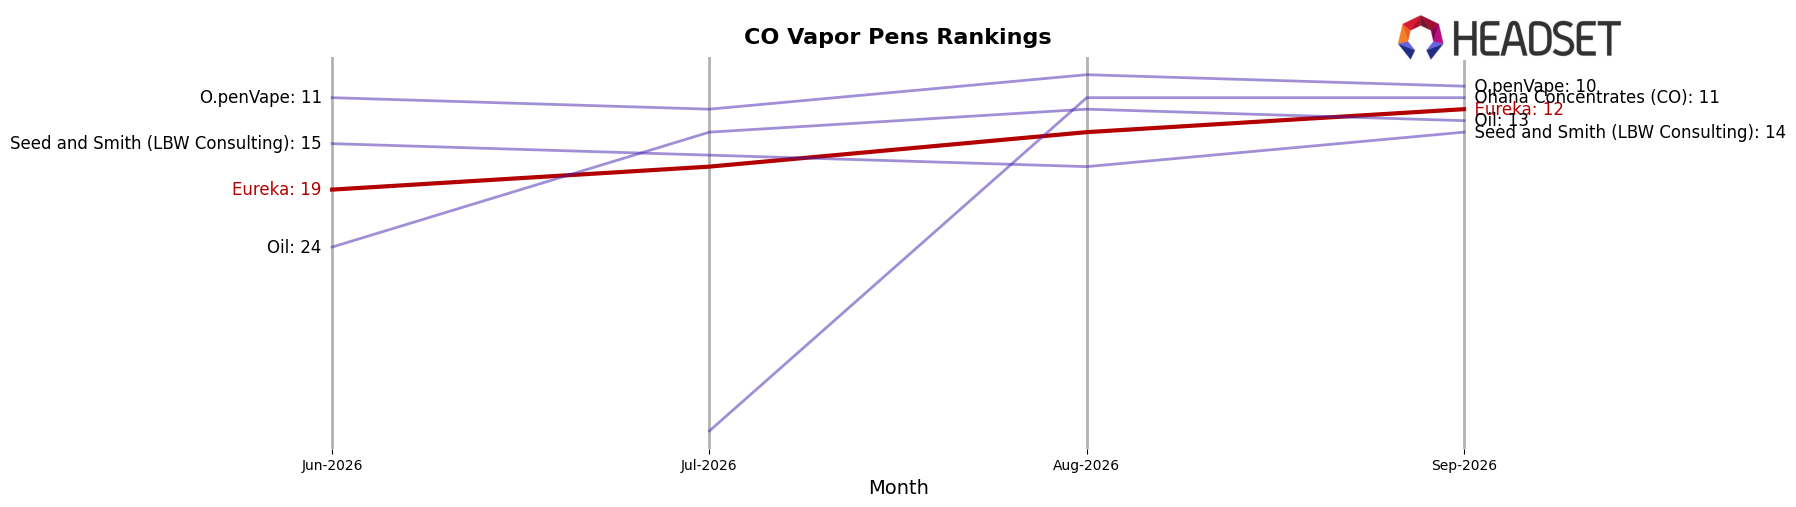
Eureka sits at rank #12 in Colorado Vapor Pens in September 2026, down 6 places year over year but up 7 positions versus June 2026 when it was #19; that rebound still trails its peak of #3 from October 2024 and leaves a 9-rank gap to regain prior territory. Competitive momentum has shifted upward at the top end: Jetty Extracts climbed from #15 to #4 year over year while growing sales 150.9%, and PAX advanced from #3 to #2 with 34.7% sales growth, whereas Eureka’s slide from #6 to #12 over the same period implies share is consolidating among faster-advancing rivals. The pattern suggests Eureka’s recent quarter-on-quarter rise (from #19 to #12) is a recovery phase rather than a new uptrend unless it can convert placement gains into sustained rank improvements relative to top-5 climbers.
Notable Products
Classic - Mango Haze Distillate Reload Pod (1g) led September 2026 with a rank of 1 but fell 22.2% month over month, while Slid3 - Melon Madness x Sour Applelicious Live Resin Disposable (1g) rose 6.1% to rank 6, indicating mix shift within Vapor Pens toward live resin formats. Two SKUs are tied at rank 2, and four of the top ten are Reload Pods, signaling a concentration in refillable formats even as the top Reload Pod contracted 22.2% and the leading disposable category presence held to rank 3. Classic - Mango Haze Distillate Reload Disposable (2g) reached rank 3, contrasting the 22.2% decline of the 1g Reload Pod and suggesting consumers are trading up in size; the category’s middle ranks (4–9) lack double-digit movers, reinforcing a barbell between premium disposables and refillable pods. The product mix implies Eureka is pivoting toward higher-capacity and live resin propositions within Vapor Pens, using rank consolidation at 1–3 and a 6.1% lift at rank 6 as signals to prioritize larger formats and resin-led extensions.
Top Selling Cannabis Brands






Data for this report comes from real-time sales reporting by participating cannabis retailers via their point-of-sale systems, which are linked up with Headset’s business intelligence software. Headset’s data is very reliable, as it comes digitally direct from our partner retailers. However, the potential does exist for misreporting in the instance of duplicates, incorrectly classified products, inaccurate entry of products into point-of-sale systems, or even simple human error at the point of purchase. Thus, there is a slight margin of error to consider. Brands listed on this page are ranked in the top twenty within the market and product category by total retail sales volume.

